Scandinavian vs Vietnamese Average Family Size
COMPARE
Scandinavian
Vietnamese
Average Family Size
Average Family Size Comparison
Scandinavians
Vietnamese
3.14
AVERAGE FAMILY SIZE
0.2/ 100
METRIC RATING
293rd/ 347
METRIC RANK
3.37
AVERAGE FAMILY SIZE
100.0/ 100
METRIC RATING
47th/ 347
METRIC RANK
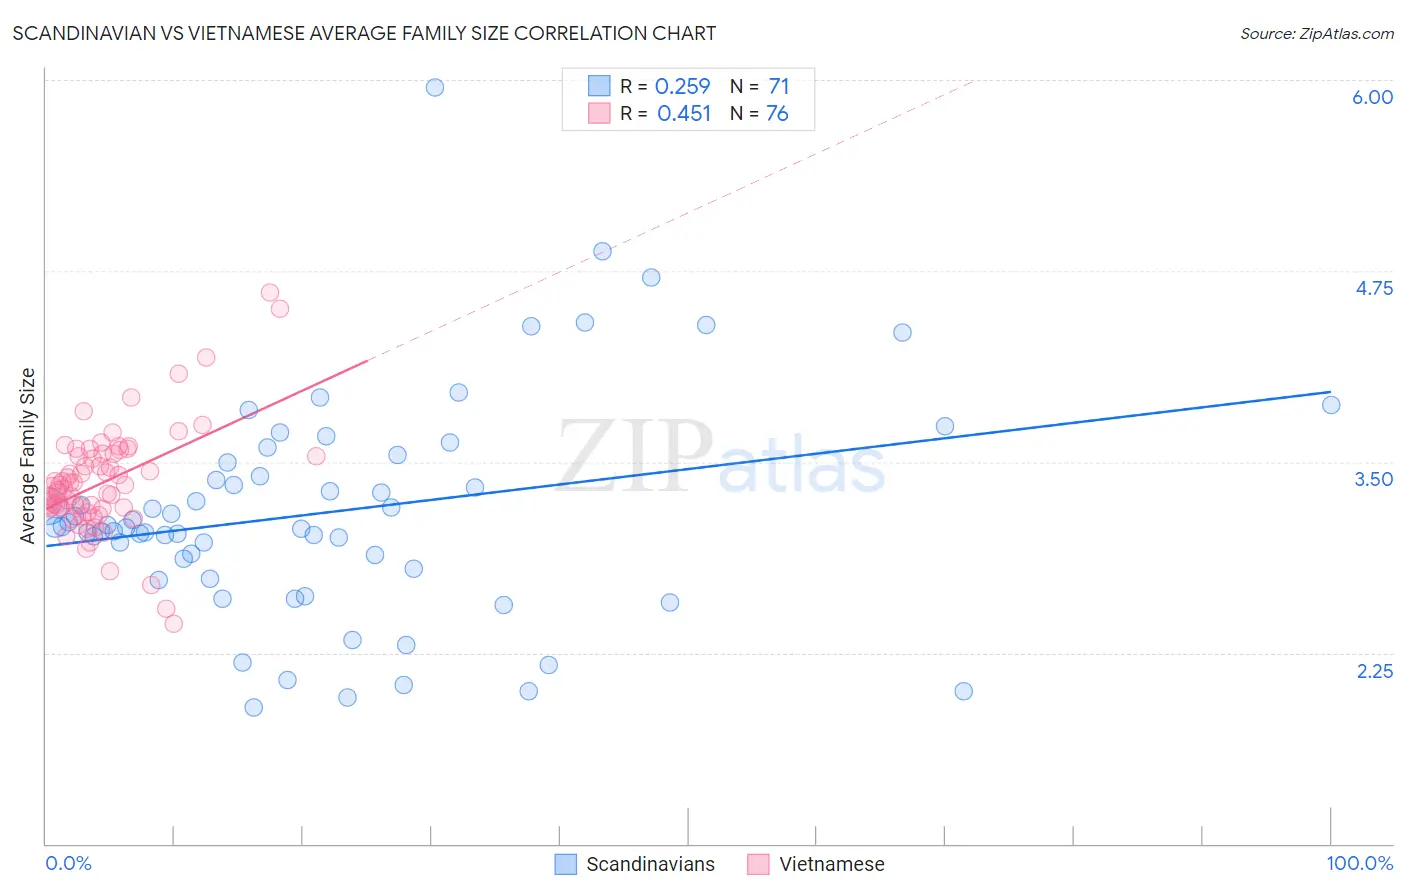
Scandinavian vs Vietnamese Average Family Size Correlation Chart
The statistical analysis conducted on geographies consisting of 472,285,775 people shows a weak positive correlation between the proportion of Scandinavians and average family size in the United States with a correlation coefficient (R) of 0.259 and weighted average of 3.14. Similarly, the statistical analysis conducted on geographies consisting of 170,658,830 people shows a moderate positive correlation between the proportion of Vietnamese and average family size in the United States with a correlation coefficient (R) of 0.451 and weighted average of 3.37, a difference of 7.4%.
Average Family Size Correlation Summary
| Measurement | Scandinavian | Vietnamese |
| Minimum | 1.89 | 2.44 |
| Maximum | 5.95 | 4.61 |
| Range | 4.06 | 2.17 |
| Mean | 3.17 | 3.36 |
| Median | 3.07 | 3.33 |
| Interquartile 25% (IQ1) | 2.80 | 3.20 |
| Interquartile 75% (IQ3) | 3.49 | 3.54 |
| Interquartile Range (IQR) | 0.69 | 0.35 |
| Standard Deviation (Sample) | 0.73 | 0.35 |
| Standard Deviation (Population) | 0.72 | 0.35 |
Similar Demographics by Average Family Size
Demographics Similar to Scandinavians by Average Family Size
In terms of average family size, the demographic groups most similar to Scandinavians are European (3.14, a difference of 0.010%), Immigrants from Croatia (3.14, a difference of 0.020%), Alsatian (3.14, a difference of 0.030%), Austrian (3.14, a difference of 0.030%), and Ukrainian (3.14, a difference of 0.030%).
| Demographics | Rating | Rank | Average Family Size |
| Immigrants | Netherlands | 0.3 /100 | #286 | Tragic 3.14 |
| Greeks | 0.3 /100 | #287 | Tragic 3.14 |
| Immigrants | Czechoslovakia | 0.3 /100 | #288 | Tragic 3.14 |
| Immigrants | Norway | 0.3 /100 | #289 | Tragic 3.14 |
| Cypriots | 0.3 /100 | #290 | Tragic 3.14 |
| Alsatians | 0.2 /100 | #291 | Tragic 3.14 |
| Europeans | 0.2 /100 | #292 | Tragic 3.14 |
| Scandinavians | 0.2 /100 | #293 | Tragic 3.14 |
| Immigrants | Croatia | 0.2 /100 | #294 | Tragic 3.14 |
| Austrians | 0.2 /100 | #295 | Tragic 3.14 |
| Ukrainians | 0.2 /100 | #296 | Tragic 3.14 |
| Immigrants | Western Europe | 0.2 /100 | #297 | Tragic 3.14 |
| Colville | 0.2 /100 | #298 | Tragic 3.14 |
| Canadians | 0.2 /100 | #299 | Tragic 3.14 |
| Immigrants | Sweden | 0.2 /100 | #300 | Tragic 3.14 |
Demographics Similar to Vietnamese by Average Family Size
In terms of average family size, the demographic groups most similar to Vietnamese are Immigrants from Nicaragua (3.37, a difference of 0.0%), Haitian (3.37, a difference of 0.040%), Bangladeshi (3.37, a difference of 0.070%), Shoshone (3.37, a difference of 0.10%), and Alaska Native (3.37, a difference of 0.13%).
| Demographics | Rating | Rank | Average Family Size |
| Belizeans | 100.0 /100 | #40 | Exceptional 3.39 |
| Marshallese | 100.0 /100 | #41 | Exceptional 3.38 |
| Immigrants | Vietnam | 100.0 /100 | #42 | Exceptional 3.38 |
| Immigrants | Philippines | 100.0 /100 | #43 | Exceptional 3.37 |
| Alaska Natives | 100.0 /100 | #44 | Exceptional 3.37 |
| Shoshone | 100.0 /100 | #45 | Exceptional 3.37 |
| Haitians | 100.0 /100 | #46 | Exceptional 3.37 |
| Vietnamese | 100.0 /100 | #47 | Exceptional 3.37 |
| Immigrants | Nicaragua | 100.0 /100 | #48 | Exceptional 3.37 |
| Bangladeshis | 100.0 /100 | #49 | Exceptional 3.37 |
| Immigrants | Bangladesh | 100.0 /100 | #50 | Exceptional 3.36 |
| Nicaraguans | 100.0 /100 | #51 | Exceptional 3.36 |
| Fijians | 100.0 /100 | #52 | Exceptional 3.36 |
| Koreans | 100.0 /100 | #53 | Exceptional 3.36 |
| Immigrants | South Eastern Asia | 100.0 /100 | #54 | Exceptional 3.36 |