Scandinavian vs Mongolian Currently Married
COMPARE
Scandinavian
Mongolian
Currently Married
Currently Married Comparison
Scandinavians
Mongolians
49.5%
CURRENTLY MARRIED
99.9/ 100
METRIC RATING
17th/ 347
METRIC RANK
46.4%
CURRENTLY MARRIED
37.6/ 100
METRIC RATING
185th/ 347
METRIC RANK
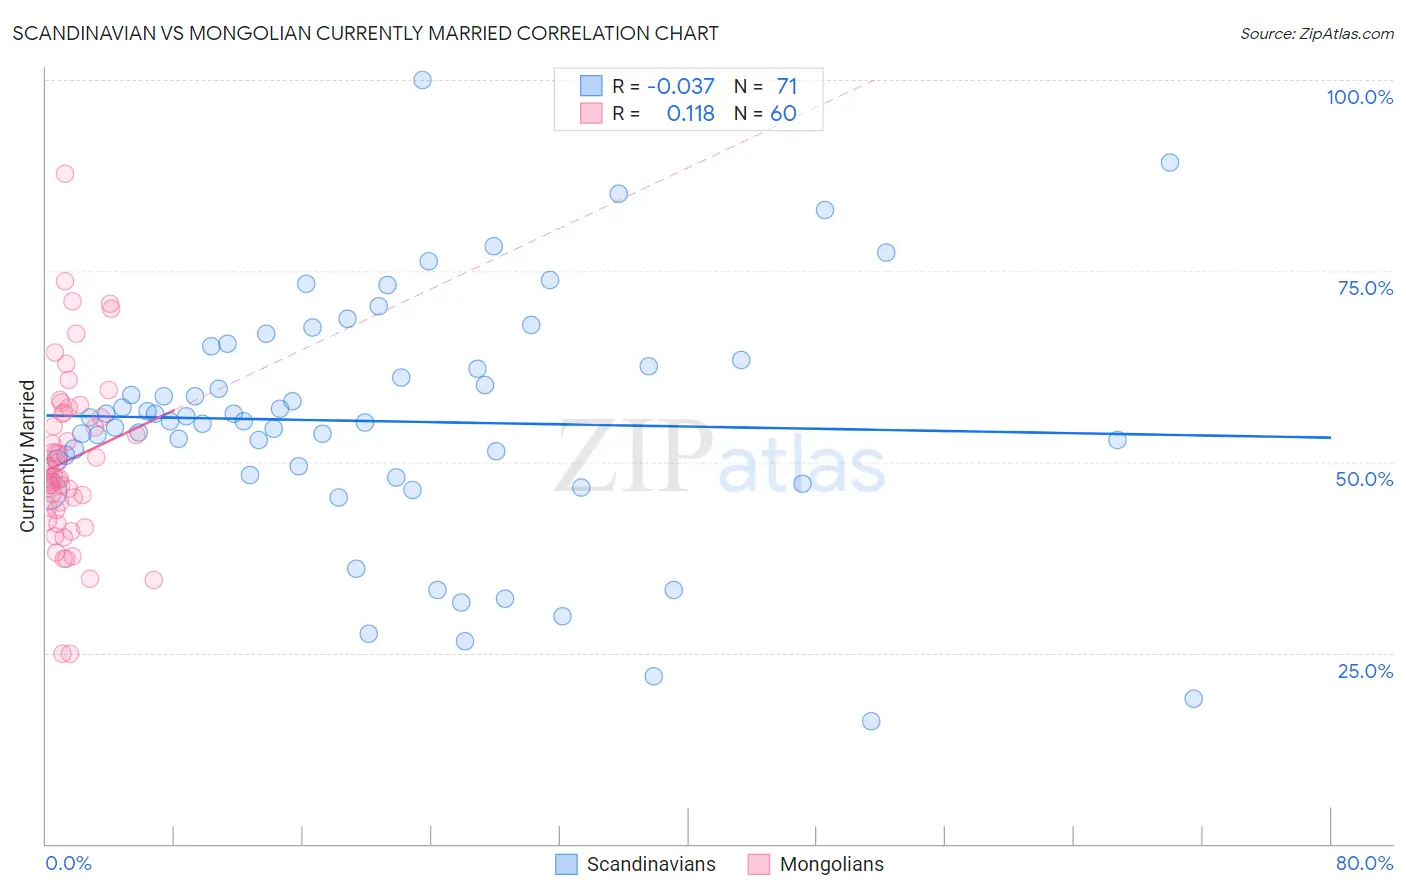
Scandinavian vs Mongolian Currently Married Correlation Chart
The statistical analysis conducted on geographies consisting of 472,583,978 people shows no correlation between the proportion of Scandinavians and percentage of population currently married in the United States with a correlation coefficient (R) of -0.037 and weighted average of 49.5%. Similarly, the statistical analysis conducted on geographies consisting of 140,349,335 people shows a poor positive correlation between the proportion of Mongolians and percentage of population currently married in the United States with a correlation coefficient (R) of 0.118 and weighted average of 46.4%, a difference of 6.6%.
Currently Married Correlation Summary
| Measurement | Scandinavian | Mongolian |
| Minimum | 16.0% | 24.8% |
| Maximum | 100.0% | 87.8% |
| Range | 84.0% | 63.0% |
| Mean | 55.3% | 50.2% |
| Median | 55.3% | 48.6% |
| Interquartile 25% (IQ1) | 48.3% | 43.9% |
| Interquartile 75% (IQ3) | 63.3% | 56.3% |
| Interquartile Range (IQR) | 15.0% | 12.4% |
| Standard Deviation (Sample) | 16.0% | 11.3% |
| Standard Deviation (Population) | 15.9% | 11.3% |
Similar Demographics by Currently Married
Demographics Similar to Scandinavians by Currently Married
In terms of currently married, the demographic groups most similar to Scandinavians are Chinese (49.5%, a difference of 0.020%), Pennsylvania German (49.6%, a difference of 0.16%), German (49.6%, a difference of 0.19%), Dutch (49.6%, a difference of 0.20%), and Immigrants from Scotland (49.3%, a difference of 0.29%).
| Demographics | Rating | Rank | Currently Married |
| Filipinos | 99.9 /100 | #10 | Exceptional 49.7% |
| English | 99.9 /100 | #11 | Exceptional 49.7% |
| Swiss | 99.9 /100 | #12 | Exceptional 49.7% |
| Dutch | 99.9 /100 | #13 | Exceptional 49.6% |
| Germans | 99.9 /100 | #14 | Exceptional 49.6% |
| Pennsylvania Germans | 99.9 /100 | #15 | Exceptional 49.6% |
| Chinese | 99.9 /100 | #16 | Exceptional 49.5% |
| Scandinavians | 99.9 /100 | #17 | Exceptional 49.5% |
| Immigrants | Scotland | 99.8 /100 | #18 | Exceptional 49.3% |
| Europeans | 99.8 /100 | #19 | Exceptional 49.3% |
| Luxembourgers | 99.8 /100 | #20 | Exceptional 49.3% |
| Scottish | 99.8 /100 | #21 | Exceptional 49.2% |
| Bulgarians | 99.7 /100 | #22 | Exceptional 49.1% |
| Immigrants | Pakistan | 99.7 /100 | #23 | Exceptional 49.1% |
| Lithuanians | 99.6 /100 | #24 | Exceptional 49.0% |
Demographics Similar to Mongolians by Currently Married
In terms of currently married, the demographic groups most similar to Mongolians are Immigrants from Chile (46.4%, a difference of 0.030%), Brazilian (46.4%, a difference of 0.070%), Immigrants from Northern Africa (46.5%, a difference of 0.080%), Immigrants from Peru (46.4%, a difference of 0.090%), and Potawatomi (46.5%, a difference of 0.16%).
| Demographics | Rating | Rank | Currently Married |
| Chickasaw | 47.8 /100 | #178 | Average 46.6% |
| Immigrants | Oceania | 44.6 /100 | #179 | Average 46.5% |
| Costa Ricans | 43.7 /100 | #180 | Average 46.5% |
| Ottawa | 43.0 /100 | #181 | Average 46.5% |
| Potawatomi | 41.9 /100 | #182 | Average 46.5% |
| Immigrants | Northern Africa | 39.7 /100 | #183 | Fair 46.5% |
| Brazilians | 39.3 /100 | #184 | Fair 46.4% |
| Mongolians | 37.6 /100 | #185 | Fair 46.4% |
| Immigrants | Chile | 36.8 /100 | #186 | Fair 46.4% |
| Immigrants | Peru | 35.3 /100 | #187 | Fair 46.4% |
| Colombians | 31.8 /100 | #188 | Fair 46.3% |
| Fijians | 30.3 /100 | #189 | Fair 46.3% |
| Choctaw | 29.1 /100 | #190 | Fair 46.3% |
| Immigrants | France | 27.7 /100 | #191 | Fair 46.2% |
| Soviet Union | 25.7 /100 | #192 | Fair 46.2% |