Scandinavian vs Immigrants from Croatia Single Mother Households
COMPARE
Scandinavian
Immigrants from Croatia
Single Mother Households
Single Mother Households Comparison
Scandinavians
Immigrants from Croatia
5.8%
SINGLE MOTHER HOUSEHOLDS
96.2/ 100
METRIC RATING
100th/ 347
METRIC RANK
5.4%
SINGLE MOTHER HOUSEHOLDS
99.4/ 100
METRIC RATING
45th/ 347
METRIC RANK
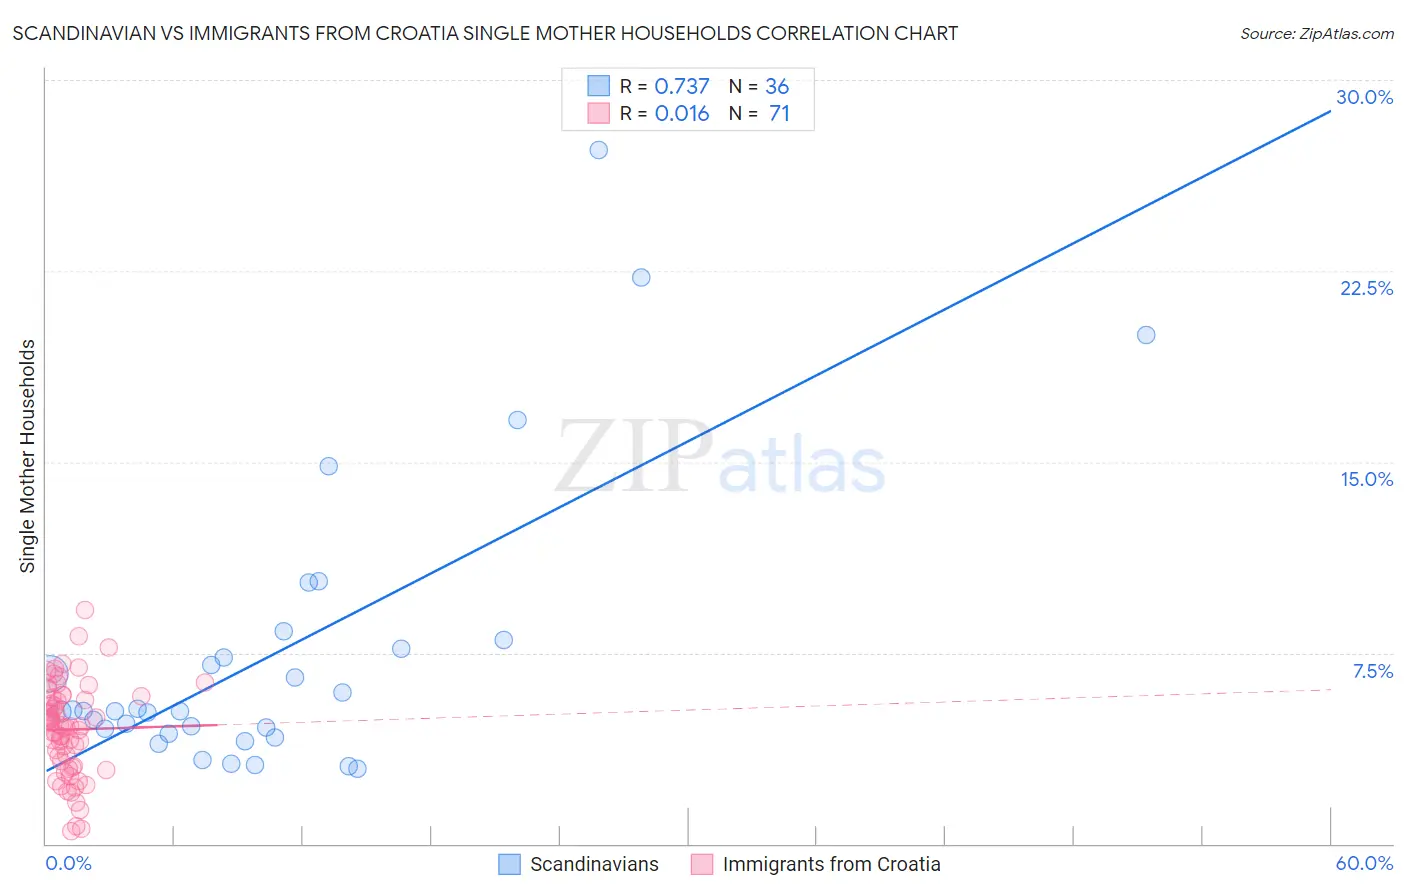
Scandinavian vs Immigrants from Croatia Single Mother Households Correlation Chart
The statistical analysis conducted on geographies consisting of 470,147,403 people shows a strong positive correlation between the proportion of Scandinavians and percentage of single mother households in the United States with a correlation coefficient (R) of 0.737 and weighted average of 5.8%. Similarly, the statistical analysis conducted on geographies consisting of 132,474,478 people shows no correlation between the proportion of Immigrants from Croatia and percentage of single mother households in the United States with a correlation coefficient (R) of 0.016 and weighted average of 5.4%, a difference of 5.7%.
Single Mother Households Correlation Summary
| Measurement | Scandinavian | Immigrants from Croatia |
| Minimum | 2.9% | 0.49% |
| Maximum | 27.3% | 9.2% |
| Range | 24.3% | 8.7% |
| Mean | 7.5% | 4.5% |
| Median | 5.2% | 4.6% |
| Interquartile 25% (IQ1) | 4.4% | 3.0% |
| Interquartile 75% (IQ3) | 7.8% | 5.7% |
| Interquartile Range (IQR) | 3.4% | 2.7% |
| Standard Deviation (Sample) | 5.7% | 1.8% |
| Standard Deviation (Population) | 5.6% | 1.8% |
Similar Demographics by Single Mother Households
Demographics Similar to Scandinavians by Single Mother Households
In terms of single mother households, the demographic groups most similar to Scandinavians are Immigrants from Poland (5.8%, a difference of 0.010%), German (5.8%, a difference of 0.030%), English (5.8%, a difference of 0.030%), Scottish (5.8%, a difference of 0.050%), and Northern European (5.8%, a difference of 0.060%).
| Demographics | Rating | Rank | Single Mother Households |
| Serbians | 96.7 /100 | #93 | Exceptional 5.7% |
| Basques | 96.7 /100 | #94 | Exceptional 5.7% |
| Slovaks | 96.6 /100 | #95 | Exceptional 5.7% |
| Austrians | 96.4 /100 | #96 | Exceptional 5.7% |
| Tlingit-Haida | 96.4 /100 | #97 | Exceptional 5.7% |
| Immigrants | South Africa | 96.3 /100 | #98 | Exceptional 5.7% |
| Immigrants | Poland | 96.3 /100 | #99 | Exceptional 5.8% |
| Scandinavians | 96.2 /100 | #100 | Exceptional 5.8% |
| Germans | 96.2 /100 | #101 | Exceptional 5.8% |
| English | 96.2 /100 | #102 | Exceptional 5.8% |
| Scottish | 96.2 /100 | #103 | Exceptional 5.8% |
| Northern Europeans | 96.2 /100 | #104 | Exceptional 5.8% |
| Taiwanese | 96.1 /100 | #105 | Exceptional 5.8% |
| Immigrants | Ukraine | 95.9 /100 | #106 | Exceptional 5.8% |
| Paraguayans | 95.8 /100 | #107 | Exceptional 5.8% |
Demographics Similar to Immigrants from Croatia by Single Mother Households
In terms of single mother households, the demographic groups most similar to Immigrants from Croatia are Lithuanian (5.4%, a difference of 0.12%), Croatian (5.5%, a difference of 0.26%), Norwegian (5.5%, a difference of 0.44%), Turkish (5.5%, a difference of 0.64%), and Immigrants from Latvia (5.5%, a difference of 0.67%).
| Demographics | Rating | Rank | Single Mother Households |
| Immigrants | Serbia | 99.6 /100 | #38 | Exceptional 5.4% |
| Immigrants | Sweden | 99.6 /100 | #39 | Exceptional 5.4% |
| Estonians | 99.6 /100 | #40 | Exceptional 5.4% |
| Immigrants | Greece | 99.5 /100 | #41 | Exceptional 5.4% |
| Macedonians | 99.5 /100 | #42 | Exceptional 5.4% |
| Immigrants | South Central Asia | 99.5 /100 | #43 | Exceptional 5.4% |
| Lithuanians | 99.4 /100 | #44 | Exceptional 5.4% |
| Immigrants | Croatia | 99.4 /100 | #45 | Exceptional 5.4% |
| Croatians | 99.3 /100 | #46 | Exceptional 5.5% |
| Norwegians | 99.3 /100 | #47 | Exceptional 5.5% |
| Turks | 99.2 /100 | #48 | Exceptional 5.5% |
| Immigrants | Latvia | 99.2 /100 | #49 | Exceptional 5.5% |
| Immigrants | Scotland | 99.2 /100 | #50 | Exceptional 5.5% |
| Immigrants | Belarus | 99.2 /100 | #51 | Exceptional 5.5% |
| Swedes | 99.1 /100 | #52 | Exceptional 5.5% |