Salvadoran vs Norwegian Single Father Households
COMPARE
Salvadoran
Norwegian
Single Father Households
Single Father Households Comparison
Salvadorans
Norwegians
2.9%
SINGLE FATHER HOUSEHOLDS
0.0/ 100
METRIC RATING
314th/ 347
METRIC RANK
2.4%
SINGLE FATHER HOUSEHOLDS
17.1/ 100
METRIC RATING
213th/ 347
METRIC RANK
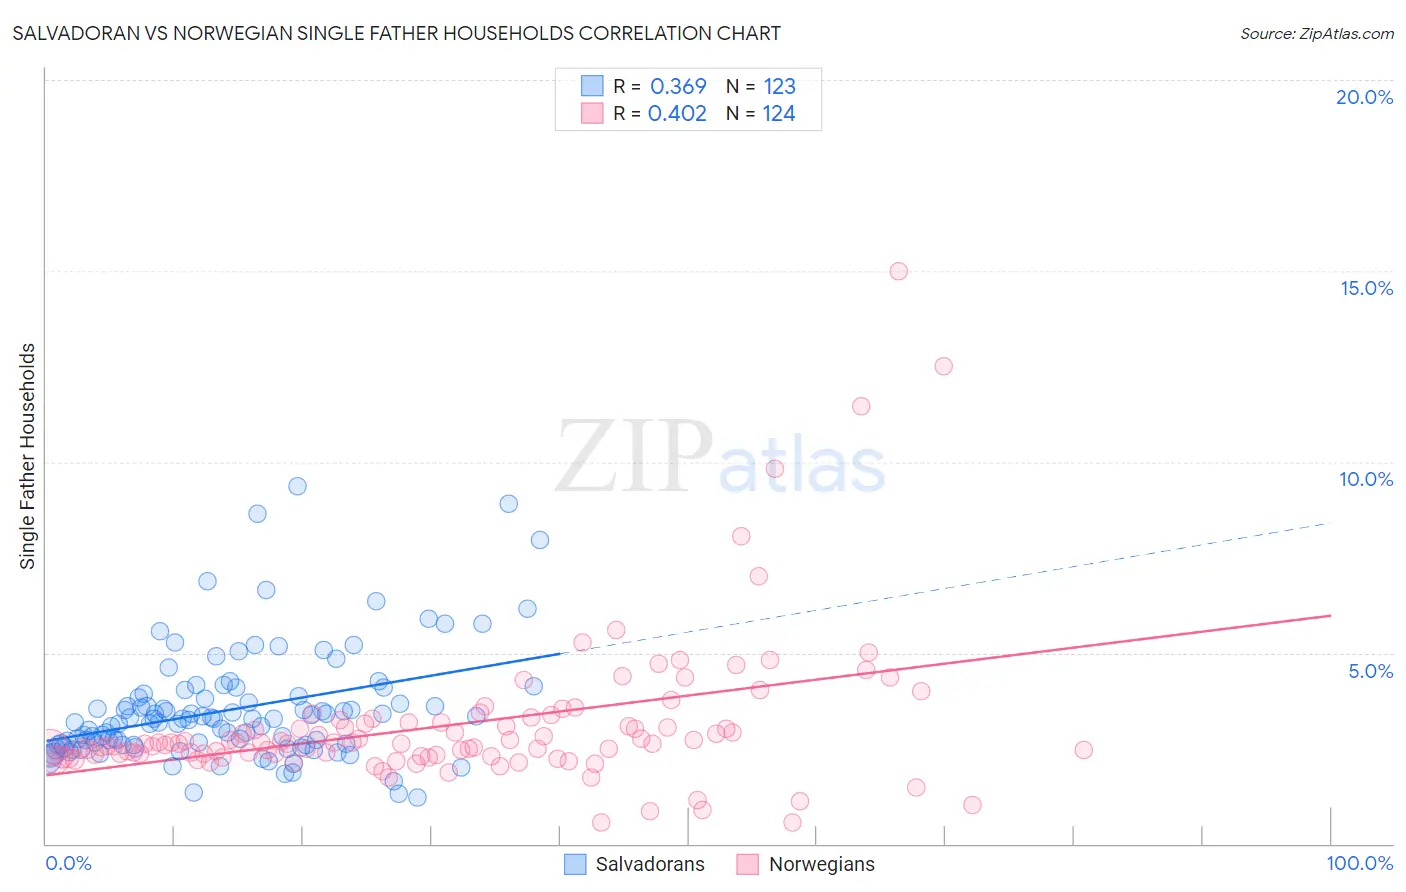
Salvadoran vs Norwegian Single Father Households Correlation Chart
The statistical analysis conducted on geographies consisting of 395,913,017 people shows a mild positive correlation between the proportion of Salvadorans and percentage of single father households in the United States with a correlation coefficient (R) of 0.369 and weighted average of 2.9%. Similarly, the statistical analysis conducted on geographies consisting of 522,435,304 people shows a moderate positive correlation between the proportion of Norwegians and percentage of single father households in the United States with a correlation coefficient (R) of 0.402 and weighted average of 2.4%, a difference of 20.9%.
Single Father Households Correlation Summary
| Measurement | Salvadoran | Norwegian |
| Minimum | 1.2% | 0.55% |
| Maximum | 9.4% | 15.0% |
| Range | 8.1% | 14.5% |
| Mean | 3.5% | 3.1% |
| Median | 3.3% | 2.6% |
| Interquartile 25% (IQ1) | 2.6% | 2.3% |
| Interquartile 75% (IQ3) | 3.9% | 3.2% |
| Interquartile Range (IQR) | 1.3% | 0.86% |
| Standard Deviation (Sample) | 1.5% | 2.0% |
| Standard Deviation (Population) | 1.5% | 2.0% |
Similar Demographics by Single Father Households
Demographics Similar to Salvadorans by Single Father Households
In terms of single father households, the demographic groups most similar to Salvadorans are Arapaho (2.9%, a difference of 0.25%), Cheyenne (2.9%, a difference of 0.39%), Houma (2.9%, a difference of 0.39%), Tsimshian (2.9%, a difference of 0.67%), and Spanish American Indian (2.9%, a difference of 1.2%).
| Demographics | Rating | Rank | Single Father Households |
| Hopi | 0.0 /100 | #307 | Tragic 2.8% |
| Apache | 0.0 /100 | #308 | Tragic 2.8% |
| Central Americans | 0.0 /100 | #309 | Tragic 2.9% |
| Immigrants | Laos | 0.0 /100 | #310 | Tragic 2.9% |
| Spanish American Indians | 0.0 /100 | #311 | Tragic 2.9% |
| Tsimshian | 0.0 /100 | #312 | Tragic 2.9% |
| Arapaho | 0.0 /100 | #313 | Tragic 2.9% |
| Salvadorans | 0.0 /100 | #314 | Tragic 2.9% |
| Cheyenne | 0.0 /100 | #315 | Tragic 2.9% |
| Houma | 0.0 /100 | #316 | Tragic 2.9% |
| Immigrants | El Salvador | 0.0 /100 | #317 | Tragic 2.9% |
| Cape Verdeans | 0.0 /100 | #318 | Tragic 2.9% |
| Ute | 0.0 /100 | #319 | Tragic 3.0% |
| Guatemalans | 0.0 /100 | #320 | Tragic 3.0% |
| Mexicans | 0.0 /100 | #321 | Tragic 3.0% |
Demographics Similar to Norwegians by Single Father Households
In terms of single father households, the demographic groups most similar to Norwegians are Ethiopian (2.4%, a difference of 0.060%), Finnish (2.4%, a difference of 0.15%), Immigrants from South Eastern Asia (2.4%, a difference of 0.16%), Immigrants from Nigeria (2.4%, a difference of 0.20%), and Immigrants from Costa Rica (2.4%, a difference of 0.25%).
| Demographics | Rating | Rank | Single Father Households |
| Koreans | 24.1 /100 | #206 | Fair 2.4% |
| Whites/Caucasians | 22.6 /100 | #207 | Fair 2.4% |
| Immigrants | Kenya | 20.3 /100 | #208 | Fair 2.4% |
| Immigrants | Peru | 19.3 /100 | #209 | Poor 2.4% |
| Immigrants | Costa Rica | 19.2 /100 | #210 | Poor 2.4% |
| Immigrants | Nigeria | 18.7 /100 | #211 | Poor 2.4% |
| Finns | 18.3 /100 | #212 | Poor 2.4% |
| Norwegians | 17.1 /100 | #213 | Poor 2.4% |
| Ethiopians | 16.6 /100 | #214 | Poor 2.4% |
| Immigrants | South Eastern Asia | 15.9 /100 | #215 | Poor 2.4% |
| Immigrants | Ecuador | 14.9 /100 | #216 | Poor 2.4% |
| Dutch | 14.3 /100 | #217 | Poor 2.4% |
| Immigrants | Ethiopia | 13.4 /100 | #218 | Poor 2.4% |
| Sudanese | 13.0 /100 | #219 | Poor 2.4% |
| Ghanaians | 12.9 /100 | #220 | Poor 2.4% |