Salvadoran vs Nonimmigrants Births to Unmarried Women
COMPARE
Salvadoran
Nonimmigrants
Births to Unmarried Women
Births to Unmarried Women Comparison
Salvadorans
Nonimmigrants
36.0%
BIRTHS TO UNMARRIED WOMEN
0.3/ 100
METRIC RATING
252nd/ 347
METRIC RANK
35.5%
BIRTHS TO UNMARRIED WOMEN
0.6/ 100
METRIC RATING
248th/ 347
METRIC RANK
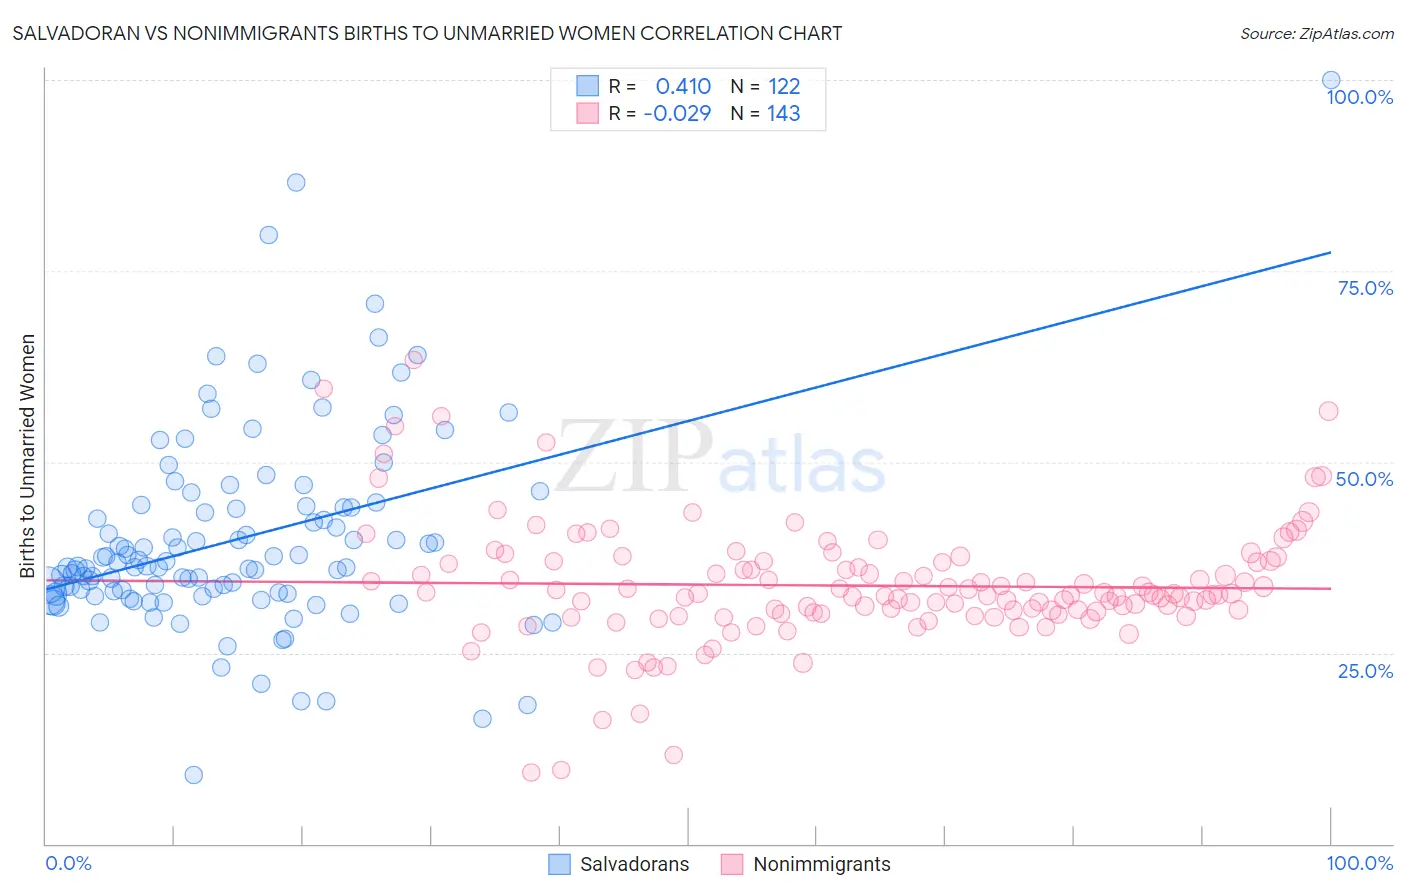
Salvadoran vs Nonimmigrants Births to Unmarried Women Correlation Chart
The statistical analysis conducted on geographies consisting of 377,312,875 people shows a moderate positive correlation between the proportion of Salvadorans and percentage of births to unmarried women in the United States with a correlation coefficient (R) of 0.410 and weighted average of 36.0%. Similarly, the statistical analysis conducted on geographies consisting of 513,664,805 people shows no correlation between the proportion of Nonimmigrants and percentage of births to unmarried women in the United States with a correlation coefficient (R) of -0.029 and weighted average of 35.5%, a difference of 1.3%.
Births to Unmarried Women Correlation Summary
| Measurement | Salvadoran | Nonimmigrants |
| Minimum | 9.0% | 9.4% |
| Maximum | 100.0% | 63.3% |
| Range | 91.0% | 53.9% |
| Mean | 40.0% | 33.8% |
| Median | 36.3% | 32.6% |
| Interquartile 25% (IQ1) | 32.7% | 30.2% |
| Interquartile 75% (IQ3) | 44.2% | 37.0% |
| Interquartile Range (IQR) | 11.5% | 6.8% |
| Standard Deviation (Sample) | 13.3% | 8.1% |
| Standard Deviation (Population) | 13.2% | 8.0% |
Demographics Similar to Salvadorans and Nonimmigrants by Births to Unmarried Women
In terms of births to unmarried women, the demographic groups most similar to Salvadorans are Immigrants from Western Africa (36.0%, a difference of 0.12%), Immigrants from Portugal (36.2%, a difference of 0.46%), Potawatomi (36.2%, a difference of 0.68%), Mexican American Indian (35.7%, a difference of 0.69%), and Chickasaw (36.3%, a difference of 0.82%). Similarly, the demographic groups most similar to Nonimmigrants are Bermudan (35.5%, a difference of 0.010%), Immigrants from Nigeria (35.4%, a difference of 0.33%), Nigerian (35.3%, a difference of 0.54%), Mexican American Indian (35.7%, a difference of 0.62%), and Shoshone (35.3%, a difference of 0.65%).
| Demographics | Rating | Rank | Births to Unmarried Women |
| Immigrants | Middle Africa | 1.2 /100 | #240 | Tragic 34.9% |
| Immigrants | Guyana | 1.2 /100 | #241 | Tragic 35.0% |
| Indonesians | 1.2 /100 | #242 | Tragic 35.0% |
| Japanese | 0.9 /100 | #243 | Tragic 35.2% |
| Guyanese | 0.9 /100 | #244 | Tragic 35.2% |
| Shoshone | 0.8 /100 | #245 | Tragic 35.3% |
| Nigerians | 0.7 /100 | #246 | Tragic 35.3% |
| Immigrants | Nigeria | 0.7 /100 | #247 | Tragic 35.4% |
| Immigrants | Nonimmigrants | 0.6 /100 | #248 | Tragic 35.5% |
| Bermudans | 0.6 /100 | #249 | Tragic 35.5% |
| Mexican American Indians | 0.4 /100 | #250 | Tragic 35.7% |
| Immigrants | Western Africa | 0.3 /100 | #251 | Tragic 36.0% |
| Salvadorans | 0.3 /100 | #252 | Tragic 36.0% |
| Immigrants | Portugal | 0.2 /100 | #253 | Tragic 36.2% |
| Potawatomi | 0.2 /100 | #254 | Tragic 36.2% |
| Chickasaw | 0.2 /100 | #255 | Tragic 36.3% |
| Immigrants | Trinidad and Tobago | 0.2 /100 | #256 | Tragic 36.3% |
| Immigrants | Grenada | 0.2 /100 | #257 | Tragic 36.3% |
| Americans | 0.2 /100 | #258 | Tragic 36.4% |
| Immigrants | El Salvador | 0.2 /100 | #259 | Tragic 36.4% |
| Ottawa | 0.2 /100 | #260 | Tragic 36.5% |