Romanian vs Immigrants from Vietnam Births to Unmarried Women

COMPARE

Romanian
Race
Ancestry
AfghanAfricanAlaska NativeAlaskan AthabascanAlbanianAleutAlsatianAmericanApacheArabArapahoArgentineanArmenianAssyrian/Chaldean/SyriacAustralianAustrianBahamianBangladeshiBarbadianBasqueBelgianBelizeanBermudanBhutaneseBlackfeetBolivianBrazilianBritishBritish West IndianBulgarianBurmeseCajunCambodianCanadianCape VerdeanCarpatho RusynCelticCentral AmericanCentral American IndianCherokeeCheyenneChickasawChileanChineseChippewaChoctawColombianColvilleComancheCosta RicanCreeCreekCroatianCrowCubanCypriotCzechCzechoslovakianDanishDelawareDominicanDutchDutch West IndianEastern EuropeanEcuadorianEgyptianEnglishEstonianEthiopianEuropeanFijianFilipinoFinnishFrenchFrench American IndianFrench CanadianGermanGerman RussianGhanaianGreekGuamanian/ChamorroGuatemalanGuyaneseHaitianHmongHonduranHopiHoumaHungarianIcelanderIndian (Asian)IndonesianInupiatIranianIraqiIrishIroquoisIsraeliItalianJamaicanJapaneseJordanianKenyanKiowaKoreanLaotianLatvianLebaneseLiberianLithuanianLumbeeLuxembourgerMacedonianMalaysianMalteseMarshalleseMenomineeMexicanMexican American IndianMongolianMoroccanNative HawaiianNavajoNepaleseNew ZealanderNicaraguanNigerianNorthern EuropeanNorwegianOkinawanOsageOttawaPaiutePakistaniPalestinianPanamanianParaguayanPennsylvania GermanPeruvianPimaPolishPortuguesePotawatomiPuebloPuerto RicanPuget Sound SalishRomanianRussianSalvadoranSamoanScandinavianScotch-IrishScottishSeminoleSenegaleseSerbianShoshoneSierra LeoneanSiouxSlavicSlovakSloveneSomaliSouth AfricanSouth AmericanSouth American IndianSoviet UnionSpaniardSpanishSpanish AmericanSpanish American IndianSri LankanSubsaharan AfricanSudaneseSwedishSwissSyrianTaiwaneseThaiTlingit-HaidaTohono O'OdhamTonganTrinidadian and TobagonianTsimshianTurkishU.S. Virgin IslanderUgandanUkrainianUruguayanUteVenezuelanVietnameseWelshWest IndianYakamaYaquiYugoslavianYumanYup'ikZimbabwean
Immigration
NonimmigrantsImmigrantsAfghanistanAfricaAlbaniaArgentinaArmeniaAsiaAustraliaAustriaBahamasBangladeshBarbadosBelarusBelgiumBelizeBoliviaBosnia and HerzegovinaBrazilBulgariaBurma/MyanmarCabo VerdeCambodiaCameroonCanadaCaribbeanCentral AmericaChileChinaColombiaCongoCosta RicaCroatiaCubaCzechoslovakiaDenmarkDominicaDominican RepublicEastern AfricaEastern AsiaEastern EuropeEcuadorEgyptEl SalvadorEnglandEritreaEthiopiaEuropeFijiFranceGermanyGhanaGreeceGrenadaGuatemalaGuyanaHaitiHondurasHong KongHungaryIndiaIndonesiaIranIraqIrelandIsraelItalyJamaicaJapanJordanKazakhstanKenyaKoreaKuwaitLaosLatin AmericaLatviaLebanonLiberiaLithuaniaMalaysiaMexicoMicronesiaMiddle AfricaMoldovaMoroccoNepalNetherlandsNicaraguaNigeriaNorth AmericaNorth MacedoniaNorthern AfricaNorthern EuropeNorwayOceaniaPakistanPanamaPeruPhilippinesPolandPortugalRomaniaRussiaSaudi ArabiaScotlandSenegalSerbiaSierra LeoneSingaporeSomaliaSouth AfricaSouth AmericaSouth Central AsiaSouth Eastern AsiaSouthern EuropeSpainSri LankaSt. Vincent and the GrenadinesSudanSwedenSwitzerlandSyriaTaiwanThailandTrinidad and TobagoTurkeyUgandaUkraineUruguayUzbekistanVenezuelaWest IndiesWestern AfricaWestern AsiaWestern EuropeYemenZaireZimbabweAzores
Immigrants from Vietnam
Race
Ancestry
AfghanAfricanAlaska NativeAlaskan AthabascanAlbanianAleutAlsatianAmericanApacheArabArapahoArgentineanArmenianAssyrian/Chaldean/SyriacAustralianAustrianBahamianBangladeshiBarbadianBasqueBelgianBelizeanBermudanBhutaneseBlackfeetBolivianBrazilianBritishBritish West IndianBulgarianBurmeseCajunCambodianCanadianCape VerdeanCarpatho RusynCelticCentral AmericanCentral American IndianCherokeeCheyenneChickasawChileanChineseChippewaChoctawColombianColvilleComancheCosta RicanCreeCreekCroatianCrowCubanCypriotCzechCzechoslovakianDanishDelawareDominicanDutchDutch West IndianEastern EuropeanEcuadorianEgyptianEnglishEstonianEthiopianEuropeanFijianFilipinoFinnishFrenchFrench American IndianFrench CanadianGermanGerman RussianGhanaianGreekGuamanian/ChamorroGuatemalanGuyaneseHaitianHmongHonduranHopiHoumaHungarianIcelanderIndian (Asian)IndonesianInupiatIranianIraqiIrishIroquoisIsraeliItalianJamaicanJapaneseJordanianKenyanKiowaKoreanLaotianLatvianLebaneseLiberianLithuanianLumbeeLuxembourgerMacedonianMalaysianMalteseMarshalleseMenomineeMexicanMexican American IndianMongolianMoroccanNative HawaiianNavajoNepaleseNew ZealanderNicaraguanNigerianNorthern EuropeanNorwegianOkinawanOsageOttawaPaiutePakistaniPalestinianPanamanianParaguayanPennsylvania GermanPeruvianPimaPolishPortuguesePotawatomiPuebloPuerto RicanPuget Sound SalishRussianSalvadoranSamoanScandinavianScotch-IrishScottishSeminoleSenegaleseSerbianShoshoneSierra LeoneanSiouxSlavicSlovakSloveneSomaliSouth AfricanSouth AmericanSouth American IndianSoviet UnionSpaniardSpanishSpanish AmericanSpanish American IndianSri LankanSubsaharan AfricanSudaneseSwedishSwissSyrianTaiwaneseThaiTlingit-HaidaTohono O'OdhamTonganTrinidadian and TobagonianTsimshianTurkishU.S. Virgin IslanderUgandanUkrainianUruguayanUteVenezuelanVietnameseWelshWest IndianYakamaYaquiYugoslavianYumanYup'ikZimbabwean
Immigration
NonimmigrantsImmigrantsAfghanistanAfricaAlbaniaArgentinaArmeniaAsiaAustraliaAustriaBahamasBangladeshBarbadosBelarusBelgiumBelizeBoliviaBosnia and HerzegovinaBrazilBulgariaBurma/MyanmarCabo VerdeCambodiaCameroonCanadaCaribbeanCentral AmericaChileChinaColombiaCongoCosta RicaCroatiaCubaCzechoslovakiaDenmarkDominicaDominican RepublicEastern AfricaEastern AsiaEastern EuropeEcuadorEgyptEl SalvadorEnglandEritreaEthiopiaEuropeFijiFranceGermanyGhanaGreeceGrenadaGuatemalaGuyanaHaitiHondurasHong KongHungaryIndiaIndonesiaIranIraqIrelandIsraelItalyJamaicaJapanJordanKazakhstanKenyaKoreaKuwaitLaosLatin AmericaLatviaLebanonLiberiaLithuaniaMalaysiaMexicoMicronesiaMiddle AfricaMoldovaMoroccoNepalNetherlandsNicaraguaNigeriaNorth AmericaNorth MacedoniaNorthern AfricaNorthern EuropeNorwayOceaniaPakistanPanamaPeruPhilippinesPolandPortugalRomaniaRussiaSaudi ArabiaScotlandSenegalSerbiaSierra LeoneSingaporeSomaliaSouth AfricaSouth AmericaSouth Central AsiaSouth Eastern AsiaSouthern EuropeSpainSri LankaSt. Vincent and the GrenadinesSudanSwedenSwitzerlandSyriaTaiwanThailandTrinidad and TobagoTurkeyUgandaUkraineUruguayUzbekistanVenezuelaVietnamWest IndiesWestern AfricaWestern AsiaWestern EuropeYemenZaireZimbabweAzores
Births to Unmarried Women
Income
Poverty
Unemployment
Labor Participation
Family Structure
Vehicle Availability
Education Level
Disability

Births to Unmarried Women Comparison

Romanians

Immigrants from Vietnam

Exceptional
Exceptional
28.7%
BIRTHS TO UNMARRIED WOMEN
98.0/ 100
METRIC RATING
82nd/ 347
METRIC RANK
29.3%
BIRTHS TO UNMARRIED WOMEN
96.1/ 100
METRIC RATING
95th/ 347
METRIC RANK

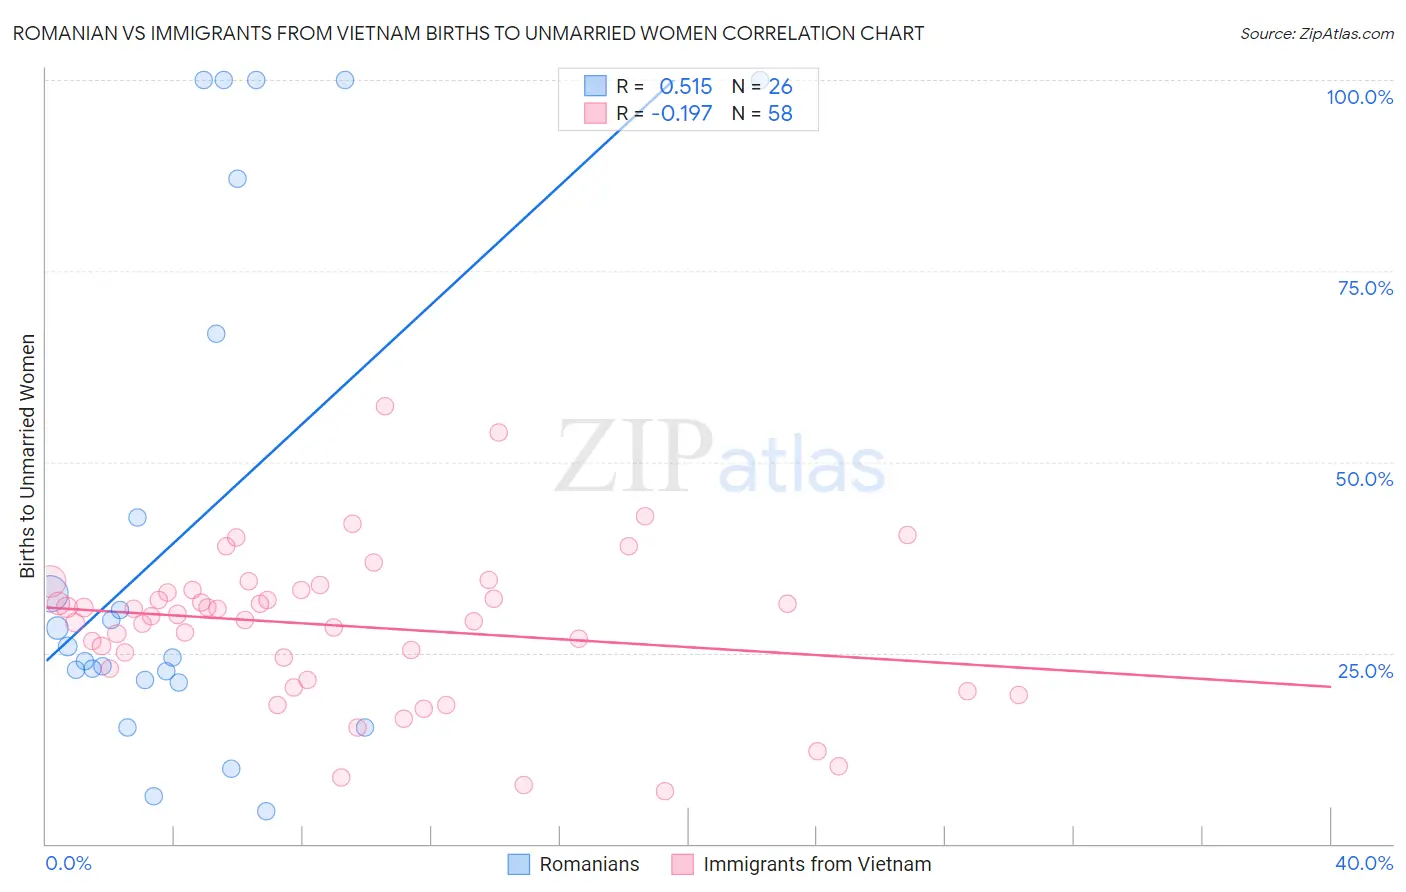
Romanian vs Immigrants from Vietnam Births to Unmarried Women Correlation Chart

The statistical analysis conducted on geographies consisting of 350,464,918 people shows a substantial positive correlation between the proportion of Romanians and percentage of births to unmarried women in the United States with a correlation coefficient (R) of 0.515 and weighted average of 28.7%. Similarly, the statistical analysis conducted on geographies consisting of 380,517,286 people shows a poor negative correlation between the proportion of Immigrants from Vietnam and percentage of births to unmarried women in the United States with a correlation coefficient (R) of -0.197 and weighted average of 29.3%, a difference of 1.8%.
Romanian vs Immigrants from Vietnam Births to Unmarried Women

Births to Unmarried Women Correlation Summary

MeasurementRomanianImmigrants from Vietnam
Minimum4.3%6.9%
Maximum100.0%57.3%
Range95.7%50.4%
Mean41.4%28.5%
Median25.1%29.9%
Interquartile 25% (IQ1)21.4%22.9%
Interquartile 75% (IQ3)66.7%33.2%
Interquartile Range (IQR)45.3%10.3%
Standard Deviation (Sample)33.7%9.9%
Standard Deviation (Population)33.1%9.9%

Demographics Similar to Romanians and Immigrants from Vietnam by Births to Unmarried Women

In terms of births to unmarried women, the demographic groups most similar to Romanians are Immigrants from Kuwait (28.8%, a difference of 0.080%), Immigrants from Austria (28.7%, a difference of 0.11%), Immigrants from Afghanistan (28.7%, a difference of 0.15%), Danish (28.7%, a difference of 0.18%), and Zimbabwean (28.7%, a difference of 0.20%). Similarly, the demographic groups most similar to Immigrants from Vietnam are Ukrainian (29.2%, a difference of 0.13%), Norwegian (29.3%, a difference of 0.23%), Estonian (29.2%, a difference of 0.26%), Immigrants from South Africa (29.3%, a difference of 0.27%), and Arab (29.2%, a difference of 0.30%).
DemographicsRating | RankBirths to Unmarried Women
Zimbabweans
98.2
/100
|
#78
Exceptional
28.7%
Danes
98.2
/100
|
#79
Exceptional
28.7%
Immigrants | Afghanistan
98.1
/100
|
#80
Exceptional
28.7%
Immigrants | Austria
98.1
/100
|
#81
Exceptional
28.7%
Romanians
98.0
/100
|
#82
Exceptional
28.7%
Immigrants | Kuwait
98.0
/100
|
#83
Exceptional
28.8%
Immigrants | Poland
97.6
/100
|
#84
Exceptional
28.9%
Sri Lankans
97.5
/100
|
#85
Exceptional
28.9%
Immigrants | Jordan
97.4
/100
|
#86
Exceptional
29.0%
Taiwanese
97.3
/100
|
#87
Exceptional
29.0%
Immigrants | France
97.3
/100
|
#88
Exceptional
29.0%
Immigrants | Saudi Arabia
97.0
/100
|
#89
Exceptional
29.1%
Immigrants | Latvia
96.8
/100
|
#90
Exceptional
29.1%
Immigrants | Fiji
96.6
/100
|
#91
Exceptional
29.2%
Arabs
96.5
/100
|
#92
Exceptional
29.2%
Estonians
96.5
/100
|
#93
Exceptional
29.2%
Ukrainians
96.3
/100
|
#94
Exceptional
29.2%
Immigrants | Vietnam
96.1
/100
|
#95
Exceptional
29.3%
Norwegians
95.8
/100
|
#96
Exceptional
29.3%
Immigrants | South Africa
95.7
/100
|
#97
Exceptional
29.3%
Immigrants | Syria
95.7
/100
|
#98
Exceptional
29.4%