Puerto Rican vs West Indian Single Mother Households
COMPARE
Puerto Rican
West Indian
Single Mother Households
Single Mother Households Comparison
Puerto Ricans
West Indians
8.7%
SINGLE MOTHER HOUSEHOLDS
0.0/ 100
METRIC RATING
336th/ 347
METRIC RANK
7.8%
SINGLE MOTHER HOUSEHOLDS
0.0/ 100
METRIC RATING
291st/ 347
METRIC RANK
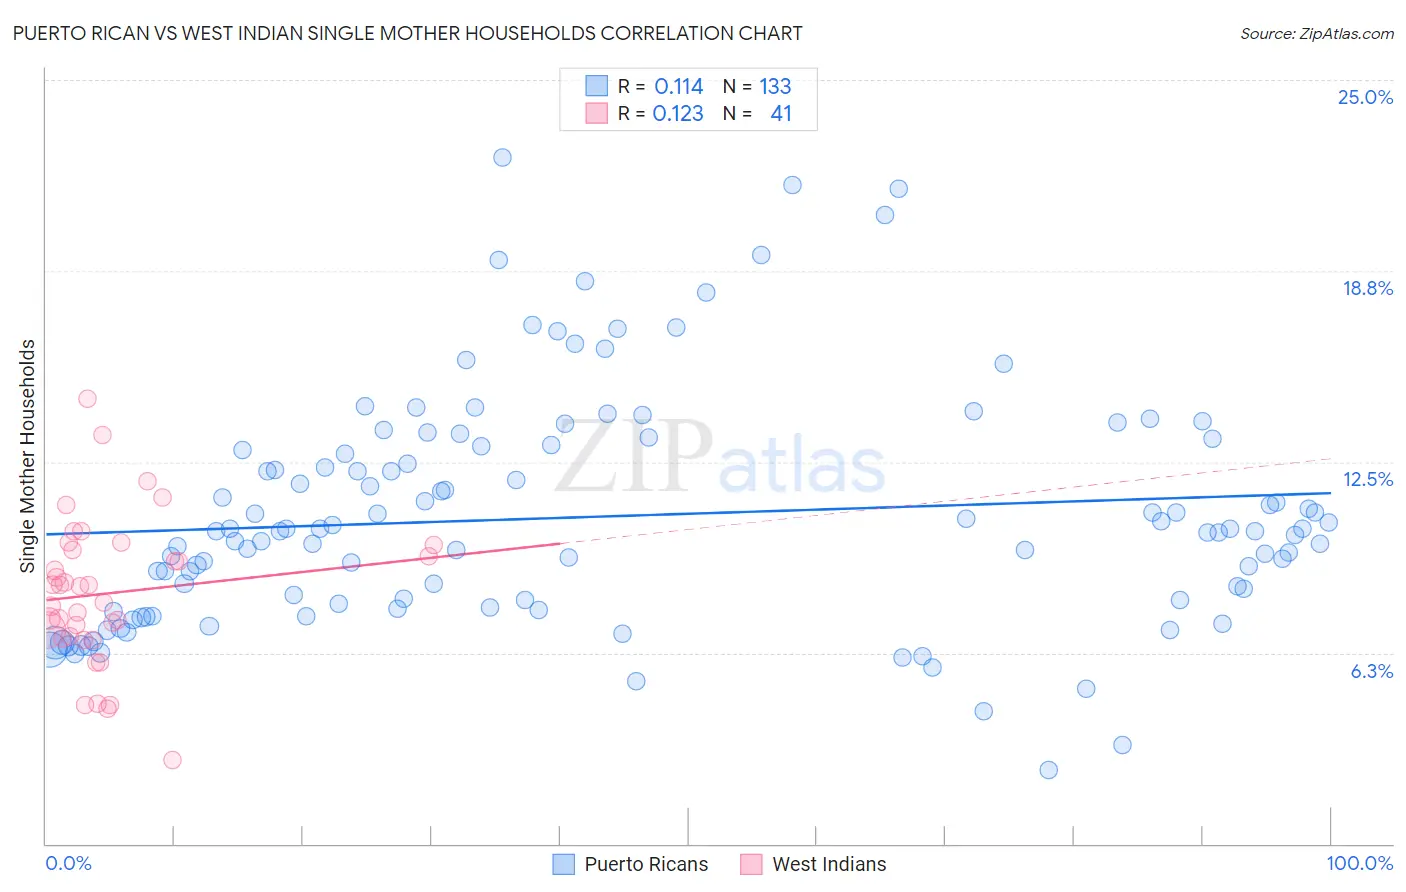
Puerto Rican vs West Indian Single Mother Households Correlation Chart
The statistical analysis conducted on geographies consisting of 525,510,984 people shows a poor positive correlation between the proportion of Puerto Ricans and percentage of single mother households in the United States with a correlation coefficient (R) of 0.114 and weighted average of 8.7%. Similarly, the statistical analysis conducted on geographies consisting of 253,636,712 people shows a poor positive correlation between the proportion of West Indians and percentage of single mother households in the United States with a correlation coefficient (R) of 0.123 and weighted average of 7.8%, a difference of 11.4%.
Single Mother Households Correlation Summary
| Measurement | Puerto Rican | West Indian |
| Minimum | 2.4% | 2.7% |
| Maximum | 22.5% | 14.6% |
| Range | 20.0% | 11.8% |
| Mean | 10.7% | 8.2% |
| Median | 10.2% | 8.4% |
| Interquartile 25% (IQ1) | 7.8% | 6.8% |
| Interquartile 75% (IQ3) | 12.9% | 9.7% |
| Interquartile Range (IQR) | 5.1% | 2.9% |
| Standard Deviation (Sample) | 3.8% | 2.4% |
| Standard Deviation (Population) | 3.8% | 2.4% |
Similar Demographics by Single Mother Households
Demographics Similar to Puerto Ricans by Single Mother Households
In terms of single mother households, the demographic groups most similar to Puerto Ricans are Immigrants from Dominica (8.7%, a difference of 0.040%), Immigrants from Liberia (8.7%, a difference of 0.33%), Liberian (8.6%, a difference of 1.1%), Navajo (8.8%, a difference of 1.2%), and Cape Verdean (8.9%, a difference of 1.3%).
| Demographics | Rating | Rank | Single Mother Households |
| Hopi | 0.0 /100 | #329 | Tragic 8.5% |
| Inupiat | 0.0 /100 | #330 | Tragic 8.5% |
| Sioux | 0.0 /100 | #331 | Tragic 8.5% |
| U.S. Virgin Islanders | 0.0 /100 | #332 | Tragic 8.6% |
| Liberians | 0.0 /100 | #333 | Tragic 8.6% |
| Immigrants | Liberia | 0.0 /100 | #334 | Tragic 8.7% |
| Immigrants | Dominica | 0.0 /100 | #335 | Tragic 8.7% |
| Puerto Ricans | 0.0 /100 | #336 | Tragic 8.7% |
| Navajo | 0.0 /100 | #337 | Tragic 8.8% |
| Cape Verdeans | 0.0 /100 | #338 | Tragic 8.9% |
| Blacks/African Americans | 0.0 /100 | #339 | Tragic 9.0% |
| Lumbee | 0.0 /100 | #340 | Tragic 9.1% |
| Tohono O'odham | 0.0 /100 | #341 | Tragic 9.1% |
| Menominee | 0.0 /100 | #342 | Tragic 9.2% |
| Dominicans | 0.0 /100 | #343 | Tragic 9.2% |
Demographics Similar to West Indians by Single Mother Households
In terms of single mother households, the demographic groups most similar to West Indians are Ghanaian (7.8%, a difference of 0.010%), Immigrants from Nigeria (7.8%, a difference of 0.080%), Immigrants from Cameroon (7.9%, a difference of 0.37%), Apache (7.9%, a difference of 0.47%), and Subsaharan African (7.8%, a difference of 0.50%).
| Demographics | Rating | Rank | Single Mother Households |
| Immigrants | Belize | 0.0 /100 | #284 | Tragic 7.7% |
| Trinidadians and Tobagonians | 0.0 /100 | #285 | Tragic 7.7% |
| Immigrants | Middle Africa | 0.0 /100 | #286 | Tragic 7.7% |
| Immigrants | Guatemala | 0.0 /100 | #287 | Tragic 7.7% |
| Sierra Leoneans | 0.0 /100 | #288 | Tragic 7.7% |
| Sub-Saharan Africans | 0.0 /100 | #289 | Tragic 7.8% |
| Immigrants | Nigeria | 0.0 /100 | #290 | Tragic 7.8% |
| West Indians | 0.0 /100 | #291 | Tragic 7.8% |
| Ghanaians | 0.0 /100 | #292 | Tragic 7.8% |
| Immigrants | Cameroon | 0.0 /100 | #293 | Tragic 7.9% |
| Apache | 0.0 /100 | #294 | Tragic 7.9% |
| Barbadians | 0.0 /100 | #295 | Tragic 7.9% |
| Immigrants | Latin America | 0.0 /100 | #296 | Tragic 7.9% |
| Hispanics or Latinos | 0.0 /100 | #297 | Tragic 7.9% |
| Immigrants | West Indies | 0.0 /100 | #298 | Tragic 7.9% |