Puerto Rican vs Immigrants from Morocco Married-couple Households
COMPARE
Puerto Rican
Immigrants from Morocco
Married-couple Households
Married-couple Households Comparison
Puerto Ricans
Immigrants from Morocco
40.1%
MARRIED-COUPLE HOUSEHOLDS
0.0/ 100
METRIC RATING
323rd/ 347
METRIC RANK
44.2%
MARRIED-COUPLE HOUSEHOLDS
0.6/ 100
METRIC RATING
247th/ 347
METRIC RANK
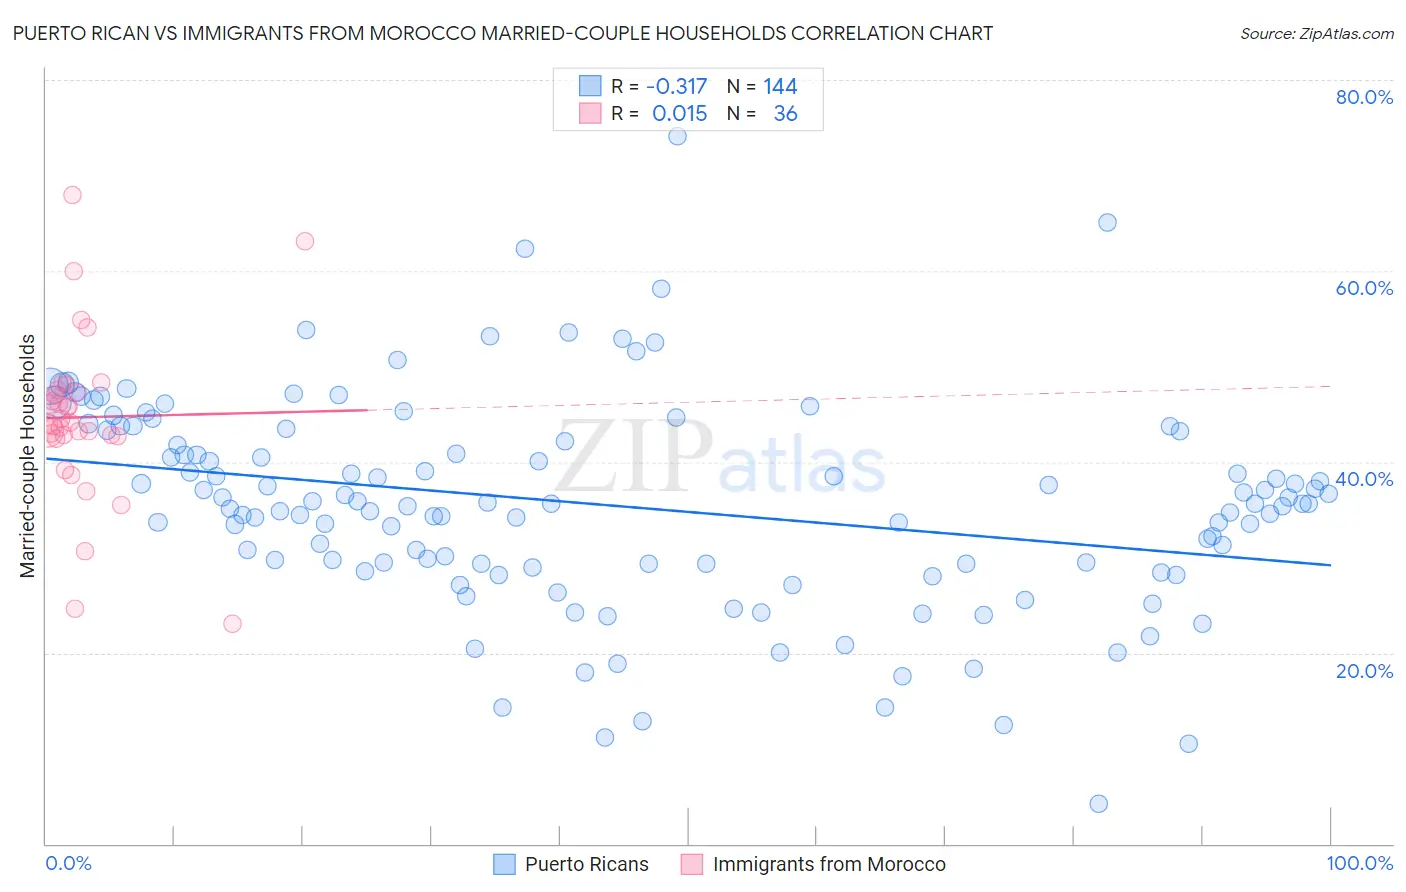
Puerto Rican vs Immigrants from Morocco Married-couple Households Correlation Chart
The statistical analysis conducted on geographies consisting of 527,687,187 people shows a mild negative correlation between the proportion of Puerto Ricans and percentage of married-couple family households in the United States with a correlation coefficient (R) of -0.317 and weighted average of 40.1%. Similarly, the statistical analysis conducted on geographies consisting of 178,909,382 people shows no correlation between the proportion of Immigrants from Morocco and percentage of married-couple family households in the United States with a correlation coefficient (R) of 0.015 and weighted average of 44.2%, a difference of 10.3%.
Married-couple Households Correlation Summary
| Measurement | Puerto Rican | Immigrants from Morocco |
| Minimum | 4.2% | 23.0% |
| Maximum | 74.1% | 68.0% |
| Range | 69.9% | 44.9% |
| Mean | 35.4% | 44.7% |
| Median | 35.6% | 44.1% |
| Interquartile 25% (IQ1) | 29.3% | 42.7% |
| Interquartile 75% (IQ3) | 42.7% | 47.4% |
| Interquartile Range (IQR) | 13.4% | 4.7% |
| Standard Deviation (Sample) | 11.0% | 8.8% |
| Standard Deviation (Population) | 11.0% | 8.6% |
Similar Demographics by Married-couple Households
Demographics Similar to Puerto Ricans by Married-couple Households
In terms of married-couple households, the demographic groups most similar to Puerto Ricans are Immigrants from Zaire (40.1%, a difference of 0.0%), Navajo (40.1%, a difference of 0.010%), Pueblo (40.0%, a difference of 0.24%), Immigrants from Liberia (40.3%, a difference of 0.66%), and West Indian (40.3%, a difference of 0.70%).
| Demographics | Rating | Rank | Married-couple Households |
| Immigrants | Caribbean | 0.0 /100 | #316 | Tragic 40.8% |
| Immigrants | Jamaica | 0.0 /100 | #317 | Tragic 40.7% |
| Liberians | 0.0 /100 | #318 | Tragic 40.7% |
| Bahamians | 0.0 /100 | #319 | Tragic 40.5% |
| West Indians | 0.0 /100 | #320 | Tragic 40.3% |
| Immigrants | Liberia | 0.0 /100 | #321 | Tragic 40.3% |
| Immigrants | Zaire | 0.0 /100 | #322 | Tragic 40.1% |
| Puerto Ricans | 0.0 /100 | #323 | Tragic 40.1% |
| Navajo | 0.0 /100 | #324 | Tragic 40.1% |
| Pueblo | 0.0 /100 | #325 | Tragic 40.0% |
| U.S. Virgin Islanders | 0.0 /100 | #326 | Tragic 39.8% |
| Lumbee | 0.0 /100 | #327 | Tragic 39.6% |
| Barbadians | 0.0 /100 | #328 | Tragic 39.4% |
| Immigrants | Dominica | 0.0 /100 | #329 | Tragic 39.4% |
| Immigrants | Barbados | 0.0 /100 | #330 | Tragic 39.2% |
Demographics Similar to Immigrants from Morocco by Married-couple Households
In terms of married-couple households, the demographic groups most similar to Immigrants from Morocco are Immigrants from Cuba (44.2%, a difference of 0.0%), Immigrants from El Salvador (44.3%, a difference of 0.15%), Immigrants from Armenia (44.3%, a difference of 0.16%), Yup'ik (44.1%, a difference of 0.28%), and Immigrants from Kenya (44.1%, a difference of 0.32%).
| Demographics | Rating | Rank | Married-couple Households |
| Ute | 1.0 /100 | #240 | Tragic 44.4% |
| Immigrants | Bosnia and Herzegovina | 1.0 /100 | #241 | Tragic 44.4% |
| Immigrants | Albania | 1.0 /100 | #242 | Tragic 44.4% |
| Immigrants | Saudi Arabia | 0.9 /100 | #243 | Tragic 44.4% |
| Immigrants | Armenia | 0.7 /100 | #244 | Tragic 44.3% |
| Immigrants | El Salvador | 0.7 /100 | #245 | Tragic 44.3% |
| Immigrants | Cuba | 0.6 /100 | #246 | Tragic 44.2% |
| Immigrants | Morocco | 0.6 /100 | #247 | Tragic 44.2% |
| Yup'ik | 0.4 /100 | #248 | Tragic 44.1% |
| Immigrants | Kenya | 0.4 /100 | #249 | Tragic 44.1% |
| French American Indians | 0.4 /100 | #250 | Tragic 44.1% |
| German Russians | 0.4 /100 | #251 | Tragic 44.0% |
| Seminole | 0.4 /100 | #252 | Tragic 44.0% |
| Central Americans | 0.3 /100 | #253 | Tragic 43.9% |
| Apache | 0.3 /100 | #254 | Tragic 43.9% |