Pueblo vs Immigrants from China Single Father Households
COMPARE
Pueblo
Immigrants from China
Single Father Households
Single Father Households Comparison
Pueblo
Immigrants from China
3.3%
SINGLE FATHER HOUSEHOLDS
0.0/ 100
METRIC RATING
337th/ 347
METRIC RANK
1.8%
SINGLE FATHER HOUSEHOLDS
100.0/ 100
METRIC RATING
9th/ 347
METRIC RANK
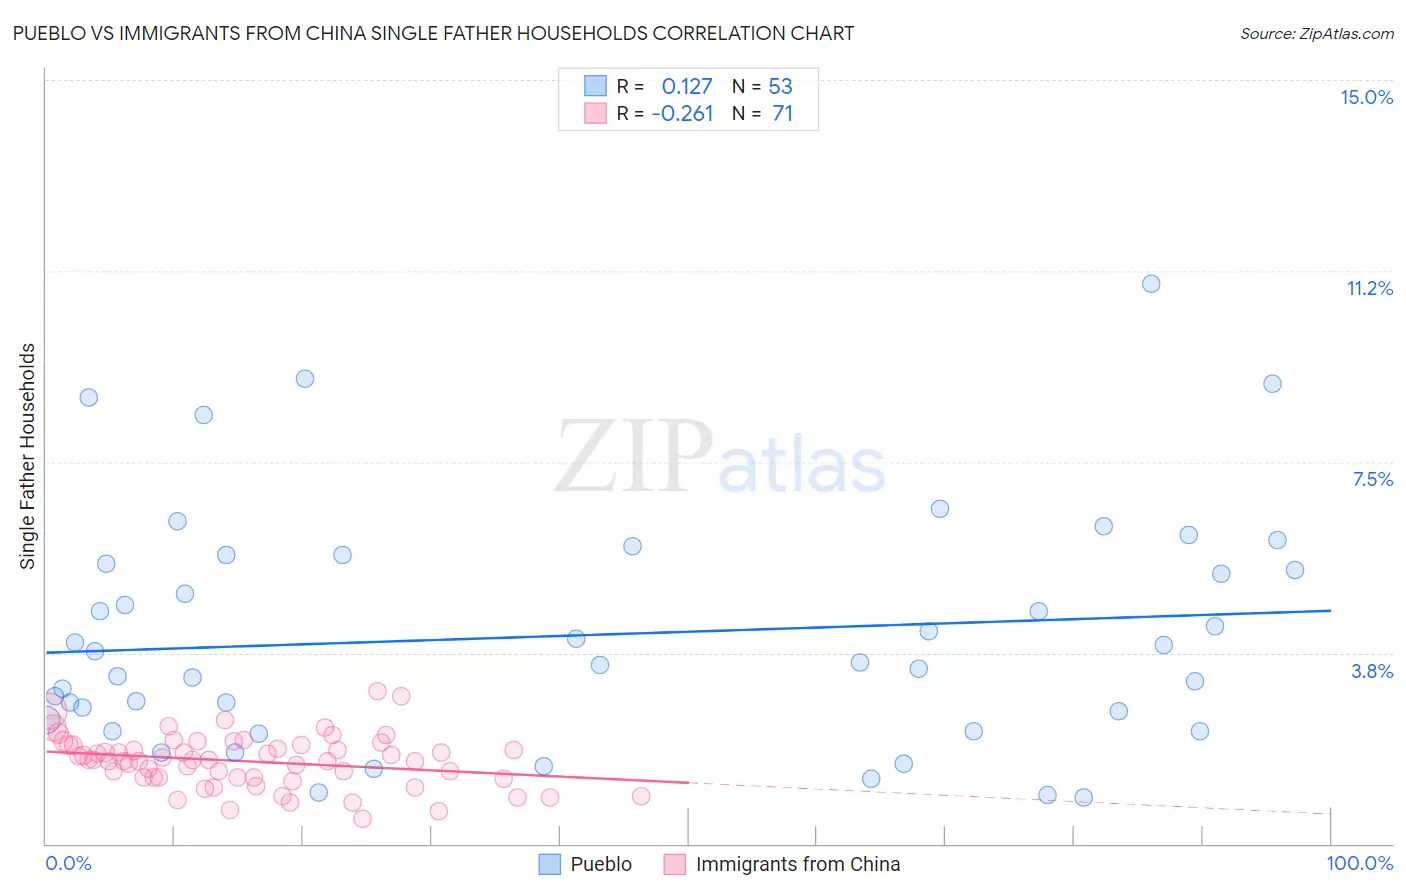
Pueblo vs Immigrants from China Single Father Households Correlation Chart
The statistical analysis conducted on geographies consisting of 119,775,080 people shows a poor positive correlation between the proportion of Pueblo and percentage of single father households in the United States with a correlation coefficient (R) of 0.127 and weighted average of 3.3%. Similarly, the statistical analysis conducted on geographies consisting of 451,618,503 people shows a weak negative correlation between the proportion of Immigrants from China and percentage of single father households in the United States with a correlation coefficient (R) of -0.261 and weighted average of 1.8%, a difference of 79.0%.
Single Father Households Correlation Summary
| Measurement | Pueblo | Immigrants from China |
| Minimum | 0.92% | 0.50% |
| Maximum | 11.0% | 3.0% |
| Range | 10.1% | 2.5% |
| Mean | 4.1% | 1.6% |
| Median | 3.6% | 1.6% |
| Interquartile 25% (IQ1) | 2.3% | 1.3% |
| Interquartile 75% (IQ3) | 5.6% | 1.9% |
| Interquartile Range (IQR) | 3.3% | 0.63% |
| Standard Deviation (Sample) | 2.3% | 0.51% |
| Standard Deviation (Population) | 2.3% | 0.50% |
Similar Demographics by Single Father Households
Demographics Similar to Pueblo by Single Father Households
In terms of single father households, the demographic groups most similar to Pueblo are Paiute (3.3%, a difference of 0.26%), Colville (3.3%, a difference of 0.28%), Yuman (3.3%, a difference of 0.30%), Sioux (3.3%, a difference of 0.68%), and Alaskan Athabascan (3.4%, a difference of 2.1%).
| Demographics | Rating | Rank | Single Father Households |
| Nepalese | 0.0 /100 | #330 | Tragic 3.1% |
| Navajo | 0.0 /100 | #331 | Tragic 3.2% |
| Yaqui | 0.0 /100 | #332 | Tragic 3.2% |
| Natives/Alaskans | 0.0 /100 | #333 | Tragic 3.2% |
| Yuman | 0.0 /100 | #334 | Tragic 3.3% |
| Colville | 0.0 /100 | #335 | Tragic 3.3% |
| Paiute | 0.0 /100 | #336 | Tragic 3.3% |
| Pueblo | 0.0 /100 | #337 | Tragic 3.3% |
| Sioux | 0.0 /100 | #338 | Tragic 3.3% |
| Alaskan Athabascans | 0.0 /100 | #339 | Tragic 3.4% |
| Alaska Natives | 0.0 /100 | #340 | Tragic 3.5% |
| Crow | 0.0 /100 | #341 | Tragic 3.5% |
| Tohono O'odham | 0.0 /100 | #342 | Tragic 3.8% |
| Pima | 0.0 /100 | #343 | Tragic 4.2% |
| Yakama | 0.0 /100 | #344 | Tragic 4.2% |
Demographics Similar to Immigrants from China by Single Father Households
In terms of single father households, the demographic groups most similar to Immigrants from China are Immigrants from Ireland (1.8%, a difference of 0.14%), Cypriot (1.8%, a difference of 0.25%), Okinawan (1.9%, a difference of 0.36%), Immigrants from Taiwan (1.8%, a difference of 0.40%), and Immigrants from Belarus (1.9%, a difference of 0.68%).
| Demographics | Rating | Rank | Single Father Households |
| Immigrants | Israel | 100.0 /100 | #2 | Exceptional 1.8% |
| Filipinos | 100.0 /100 | #3 | Exceptional 1.8% |
| Immigrants | Uzbekistan | 100.0 /100 | #4 | Exceptional 1.8% |
| Immigrants | Hong Kong | 100.0 /100 | #5 | Exceptional 1.8% |
| Immigrants | Taiwan | 100.0 /100 | #6 | Exceptional 1.8% |
| Cypriots | 100.0 /100 | #7 | Exceptional 1.8% |
| Immigrants | Ireland | 100.0 /100 | #8 | Exceptional 1.8% |
| Immigrants | China | 100.0 /100 | #9 | Exceptional 1.8% |
| Okinawans | 100.0 /100 | #10 | Exceptional 1.9% |
| Immigrants | Belarus | 100.0 /100 | #11 | Exceptional 1.9% |
| Immigrants | Greece | 100.0 /100 | #12 | Exceptional 1.9% |
| Immigrants | Singapore | 100.0 /100 | #13 | Exceptional 1.9% |
| Immigrants | Lithuania | 100.0 /100 | #14 | Exceptional 1.9% |
| Immigrants | Eastern Asia | 100.0 /100 | #15 | Exceptional 1.9% |
| Immigrants | Iran | 100.0 /100 | #16 | Exceptional 1.9% |