Portuguese vs Pakistani Married-couple Households
COMPARE
Portuguese
Pakistani
Married-couple Households
Married-couple Households Comparison
Portuguese
Pakistanis
47.8%
MARRIED-COUPLE HOUSEHOLDS
95.5/ 100
METRIC RATING
106th/ 347
METRIC RANK
47.3%
MARRIED-COUPLE HOUSEHOLDS
88.6/ 100
METRIC RATING
126th/ 347
METRIC RANK
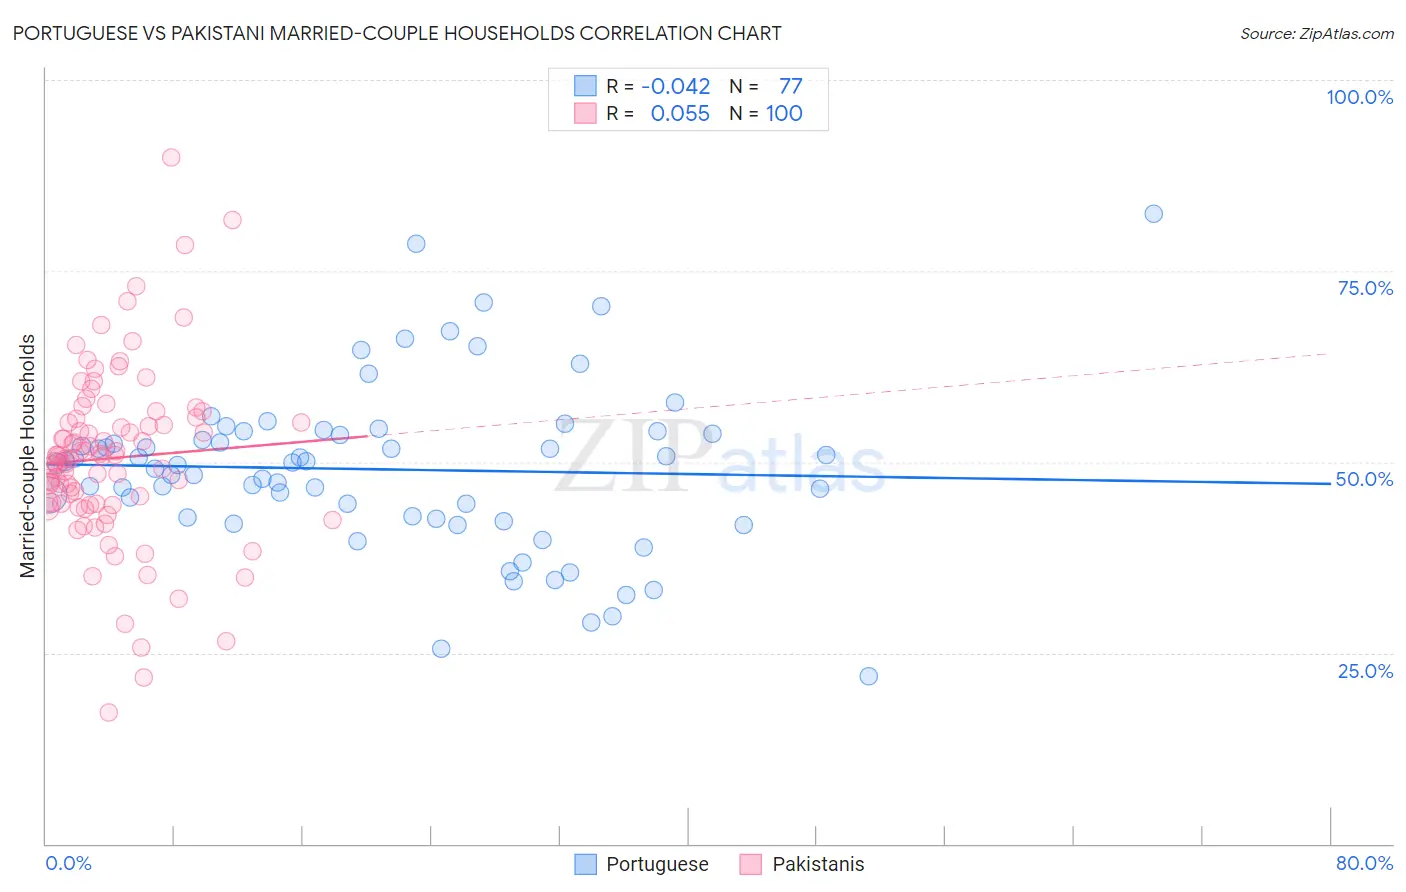
Portuguese vs Pakistani Married-couple Households Correlation Chart
The statistical analysis conducted on geographies consisting of 449,970,895 people shows no correlation between the proportion of Portuguese and percentage of married-couple family households in the United States with a correlation coefficient (R) of -0.042 and weighted average of 47.8%. Similarly, the statistical analysis conducted on geographies consisting of 335,163,838 people shows a slight positive correlation between the proportion of Pakistanis and percentage of married-couple family households in the United States with a correlation coefficient (R) of 0.055 and weighted average of 47.3%, a difference of 0.92%.
Married-couple Households Correlation Summary
| Measurement | Portuguese | Pakistani |
| Minimum | 21.9% | 17.3% |
| Maximum | 82.5% | 89.9% |
| Range | 60.6% | 72.7% |
| Mean | 49.0% | 50.5% |
| Median | 49.8% | 50.6% |
| Interquartile 25% (IQ1) | 42.6% | 44.5% |
| Interquartile 75% (IQ3) | 53.9% | 55.5% |
| Interquartile Range (IQR) | 11.3% | 10.9% |
| Standard Deviation (Sample) | 10.9% | 11.5% |
| Standard Deviation (Population) | 10.9% | 11.4% |
Demographics Similar to Portuguese and Pakistanis by Married-couple Households
In terms of married-couple households, the demographic groups most similar to Portuguese are Estonian (47.7%, a difference of 0.16%), Immigrants from Japan (47.7%, a difference of 0.21%), Immigrants from Jordan (47.7%, a difference of 0.27%), Macedonian (47.6%, a difference of 0.29%), and Syrian (47.6%, a difference of 0.29%). Similarly, the demographic groups most similar to Pakistanis are Australian (47.4%, a difference of 0.030%), Zimbabwean (47.4%, a difference of 0.050%), Immigrants from Venezuela (47.4%, a difference of 0.060%), Okinawan (47.4%, a difference of 0.15%), and Immigrants from Eastern Europe (47.4%, a difference of 0.17%).
| Demographics | Rating | Rank | Married-couple Households |
| Portuguese | 95.5 /100 | #106 | Exceptional 47.8% |
| Estonians | 94.7 /100 | #107 | Exceptional 47.7% |
| Immigrants | Japan | 94.4 /100 | #108 | Exceptional 47.7% |
| Immigrants | Jordan | 94.1 /100 | #109 | Exceptional 47.7% |
| Macedonians | 93.9 /100 | #110 | Exceptional 47.6% |
| Syrians | 93.9 /100 | #111 | Exceptional 47.6% |
| Peruvians | 93.8 /100 | #112 | Exceptional 47.6% |
| Venezuelans | 93.8 /100 | #113 | Exceptional 47.6% |
| Immigrants | Europe | 93.7 /100 | #114 | Exceptional 47.6% |
| Slovaks | 92.9 /100 | #115 | Exceptional 47.6% |
| Argentineans | 92.5 /100 | #116 | Exceptional 47.5% |
| French Canadians | 92.4 /100 | #117 | Exceptional 47.5% |
| Immigrants | Germany | 92.4 /100 | #118 | Exceptional 47.5% |
| Chileans | 92.2 /100 | #119 | Exceptional 47.5% |
| Puget Sound Salish | 90.5 /100 | #120 | Exceptional 47.4% |
| Immigrants | Eastern Europe | 90.3 /100 | #121 | Exceptional 47.4% |
| Okinawans | 90.1 /100 | #122 | Exceptional 47.4% |
| Immigrants | Venezuela | 89.3 /100 | #123 | Excellent 47.4% |
| Zimbabweans | 89.2 /100 | #124 | Excellent 47.4% |
| Australians | 89.0 /100 | #125 | Excellent 47.4% |
| Pakistanis | 88.6 /100 | #126 | Excellent 47.3% |