Portuguese vs Okinawan Births to Unmarried Women
COMPARE
Portuguese
Okinawan
Births to Unmarried Women
Births to Unmarried Women Comparison
Portuguese
Okinawans
33.8%
BIRTHS TO UNMARRIED WOMEN
5.4/ 100
METRIC RATING
220th/ 347
METRIC RANK
26.9%
BIRTHS TO UNMARRIED WOMEN
99.8/ 100
METRIC RATING
28th/ 347
METRIC RANK
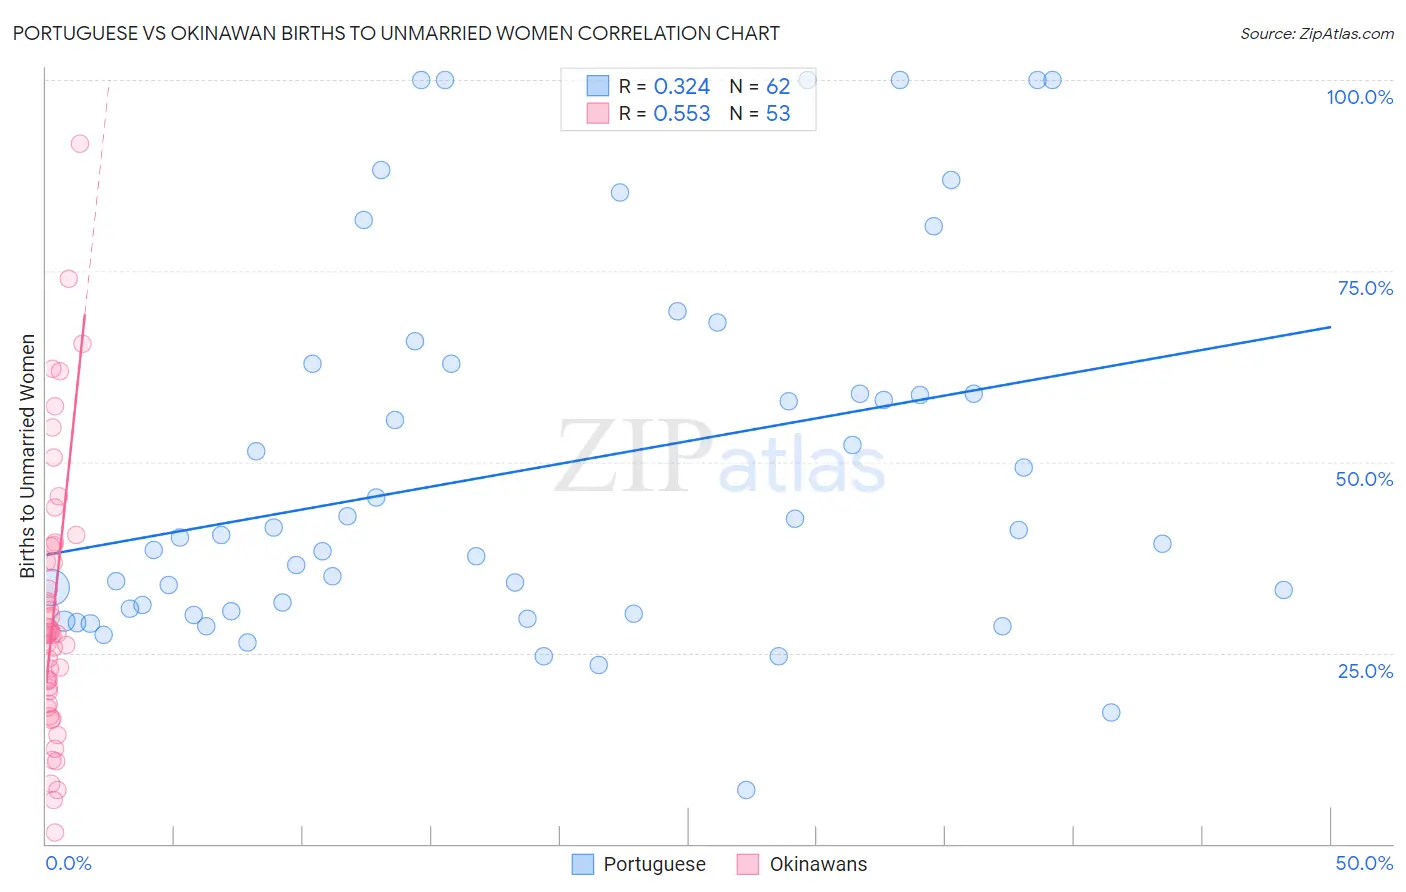
Portuguese vs Okinawan Births to Unmarried Women Correlation Chart
The statistical analysis conducted on geographies consisting of 413,543,833 people shows a mild positive correlation between the proportion of Portuguese and percentage of births to unmarried women in the United States with a correlation coefficient (R) of 0.324 and weighted average of 33.8%. Similarly, the statistical analysis conducted on geographies consisting of 71,741,584 people shows a substantial positive correlation between the proportion of Okinawans and percentage of births to unmarried women in the United States with a correlation coefficient (R) of 0.553 and weighted average of 26.9%, a difference of 25.6%.
Births to Unmarried Women Correlation Summary
| Measurement | Portuguese | Okinawan |
| Minimum | 7.1% | 1.4% |
| Maximum | 100.0% | 91.7% |
| Range | 92.9% | 90.3% |
| Mean | 49.2% | 30.7% |
| Median | 40.3% | 27.4% |
| Interquartile 25% (IQ1) | 30.5% | 19.2% |
| Interquartile 75% (IQ3) | 62.8% | 39.0% |
| Interquartile Range (IQR) | 32.3% | 19.9% |
| Standard Deviation (Sample) | 24.4% | 18.0% |
| Standard Deviation (Population) | 24.2% | 17.8% |
Similar Demographics by Births to Unmarried Women
Demographics Similar to Portuguese by Births to Unmarried Women
In terms of births to unmarried women, the demographic groups most similar to Portuguese are Alsatian (33.8%, a difference of 0.020%), Malaysian (33.9%, a difference of 0.17%), Immigrants from Ecuador (33.7%, a difference of 0.24%), Immigrants from Uruguay (33.9%, a difference of 0.24%), and Pennsylvania German (34.0%, a difference of 0.53%).
| Demographics | Rating | Rank | Births to Unmarried Women |
| Immigrants | Costa Rica | 9.5 /100 | #213 | Tragic 33.4% |
| Slovaks | 9.3 /100 | #214 | Tragic 33.4% |
| French | 8.7 /100 | #215 | Tragic 33.4% |
| Nepalese | 7.8 /100 | #216 | Tragic 33.5% |
| Spaniards | 7.0 /100 | #217 | Tragic 33.6% |
| Immigrants | Ecuador | 5.9 /100 | #218 | Tragic 33.7% |
| Alsatians | 5.4 /100 | #219 | Tragic 33.8% |
| Portuguese | 5.4 /100 | #220 | Tragic 33.8% |
| Malaysians | 5.0 /100 | #221 | Tragic 33.9% |
| Immigrants | Uruguay | 4.8 /100 | #222 | Tragic 33.9% |
| Pennsylvania Germans | 4.3 /100 | #223 | Tragic 34.0% |
| Immigrants | Laos | 4.3 /100 | #224 | Tragic 34.0% |
| Spanish | 4.0 /100 | #225 | Tragic 34.1% |
| Delaware | 3.3 /100 | #226 | Tragic 34.2% |
| Immigrants | Panama | 3.3 /100 | #227 | Tragic 34.2% |
Demographics Similar to Okinawans by Births to Unmarried Women
In terms of births to unmarried women, the demographic groups most similar to Okinawans are Cypriot (27.0%, a difference of 0.36%), Immigrants from Asia (26.8%, a difference of 0.51%), Asian (26.8%, a difference of 0.52%), Bulgarian (27.1%, a difference of 0.52%), and Immigrants from Iraq (27.1%, a difference of 0.81%).
| Demographics | Rating | Rank | Births to Unmarried Women |
| Soviet Union | 99.9 /100 | #21 | Exceptional 26.3% |
| Burmese | 99.9 /100 | #22 | Exceptional 26.4% |
| Immigrants | Japan | 99.9 /100 | #23 | Exceptional 26.4% |
| Immigrants | Australia | 99.9 /100 | #24 | Exceptional 26.6% |
| Cambodians | 99.9 /100 | #25 | Exceptional 26.7% |
| Asians | 99.9 /100 | #26 | Exceptional 26.8% |
| Immigrants | Asia | 99.9 /100 | #27 | Exceptional 26.8% |
| Okinawans | 99.8 /100 | #28 | Exceptional 26.9% |
| Cypriots | 99.8 /100 | #29 | Exceptional 27.0% |
| Bulgarians | 99.8 /100 | #30 | Exceptional 27.1% |
| Immigrants | Iraq | 99.8 /100 | #31 | Exceptional 27.1% |
| Immigrants | Russia | 99.8 /100 | #32 | Exceptional 27.1% |
| Immigrants | Sri Lanka | 99.8 /100 | #33 | Exceptional 27.2% |
| Immigrants | Pakistan | 99.8 /100 | #34 | Exceptional 27.2% |
| Immigrants | Ireland | 99.7 /100 | #35 | Exceptional 27.2% |