Portuguese vs Chilean Divorced or Separated
COMPARE
Portuguese
Chilean
Divorced or Separated
Divorced or Separated Comparison
Portuguese
Chileans
12.2%
DIVORCED OR SEPARATED
23.5/ 100
METRIC RATING
202nd/ 347
METRIC RANK
12.0%
DIVORCED OR SEPARATED
71.3/ 100
METRIC RATING
154th/ 347
METRIC RANK
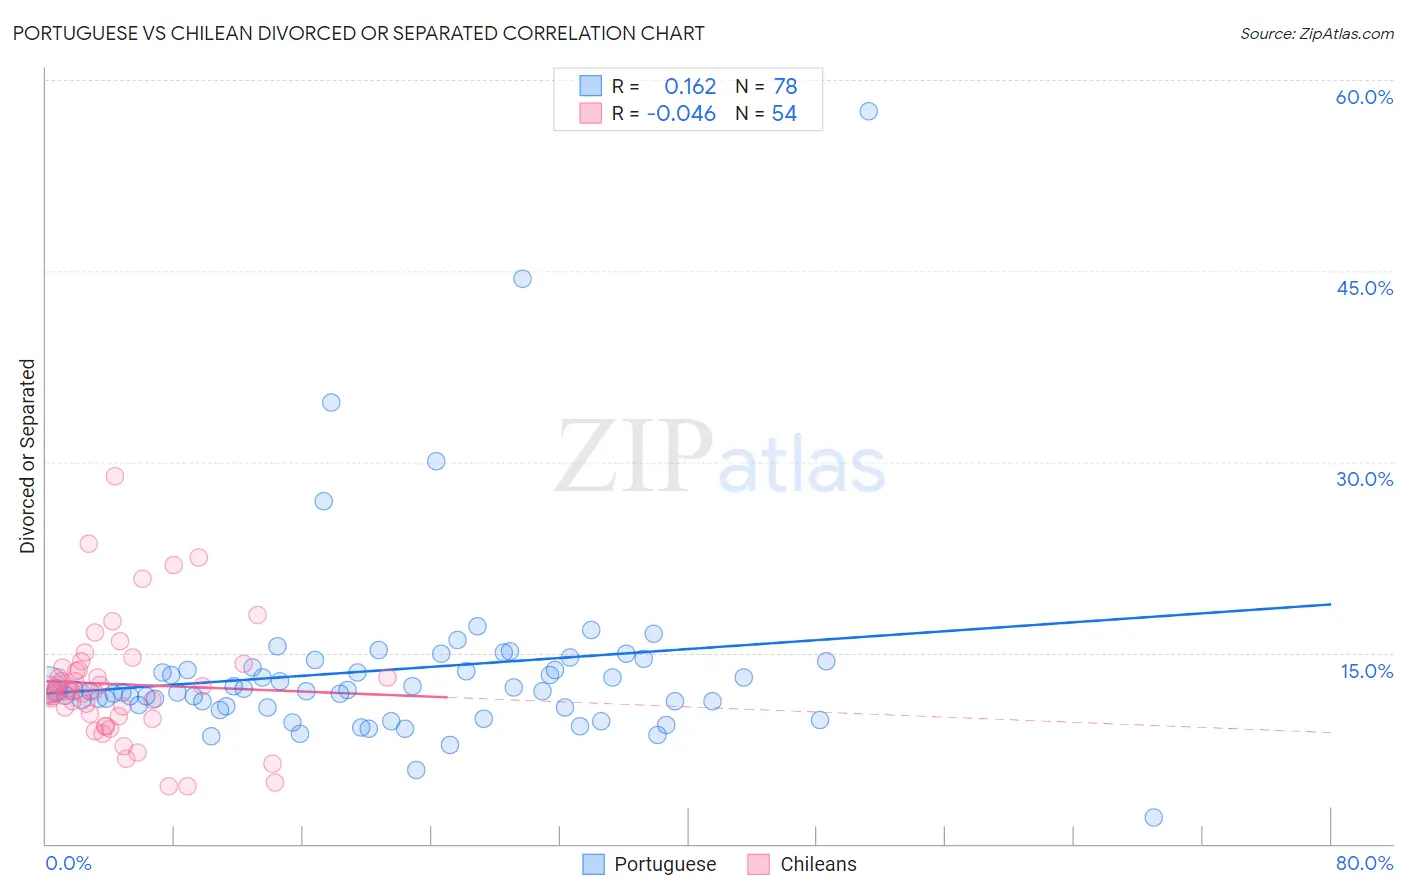
Portuguese vs Chilean Divorced or Separated Correlation Chart
The statistical analysis conducted on geographies consisting of 450,104,326 people shows a poor positive correlation between the proportion of Portuguese and percentage of population currently divorced or separated in the United States with a correlation coefficient (R) of 0.162 and weighted average of 12.2%. Similarly, the statistical analysis conducted on geographies consisting of 256,589,464 people shows no correlation between the proportion of Chileans and percentage of population currently divorced or separated in the United States with a correlation coefficient (R) of -0.046 and weighted average of 12.0%, a difference of 1.8%.
Divorced or Separated Correlation Summary
| Measurement | Portuguese | Chilean |
| Minimum | 2.1% | 4.5% |
| Maximum | 57.5% | 28.8% |
| Range | 55.4% | 24.3% |
| Mean | 13.6% | 12.5% |
| Median | 12.0% | 12.0% |
| Interquartile 25% (IQ1) | 10.8% | 10.0% |
| Interquartile 75% (IQ3) | 13.9% | 13.9% |
| Interquartile Range (IQR) | 3.1% | 3.9% |
| Standard Deviation (Sample) | 7.6% | 4.7% |
| Standard Deviation (Population) | 7.5% | 4.6% |
Similar Demographics by Divorced or Separated
Demographics Similar to Portuguese by Divorced or Separated
In terms of divorced or separated, the demographic groups most similar to Portuguese are Immigrants from Guatemala (12.2%, a difference of 0.020%), Kenyan (12.2%, a difference of 0.080%), Immigrants from Costa Rica (12.2%, a difference of 0.11%), Slovak (12.2%, a difference of 0.12%), and Mexican (12.2%, a difference of 0.13%).
| Demographics | Rating | Rank | Divorced or Separated |
| Immigrants | England | 31.4 /100 | #195 | Fair 12.1% |
| Immigrants | Burma/Myanmar | 30.4 /100 | #196 | Fair 12.1% |
| Immigrants | Africa | 30.3 /100 | #197 | Fair 12.1% |
| Nigerians | 30.1 /100 | #198 | Fair 12.1% |
| Central Americans | 29.4 /100 | #199 | Fair 12.1% |
| South Americans | 28.6 /100 | #200 | Fair 12.2% |
| Guatemalans | 26.9 /100 | #201 | Fair 12.2% |
| Portuguese | 23.5 /100 | #202 | Fair 12.2% |
| Immigrants | Guatemala | 23.2 /100 | #203 | Fair 12.2% |
| Kenyans | 21.8 /100 | #204 | Fair 12.2% |
| Immigrants | Costa Rica | 21.3 /100 | #205 | Fair 12.2% |
| Slovaks | 21.0 /100 | #206 | Fair 12.2% |
| Mexicans | 21.0 /100 | #207 | Fair 12.2% |
| Immigrants | Ghana | 18.8 /100 | #208 | Poor 12.2% |
| Immigrants | Trinidad and Tobago | 17.8 /100 | #209 | Poor 12.2% |
Demographics Similar to Chileans by Divorced or Separated
In terms of divorced or separated, the demographic groups most similar to Chileans are Japanese (12.0%, a difference of 0.020%), Austrian (12.0%, a difference of 0.040%), Hungarian (12.0%, a difference of 0.040%), Immigrants from Hungary (11.9%, a difference of 0.10%), and Immigrants from Brazil (12.0%, a difference of 0.10%).
| Demographics | Rating | Rank | Divorced or Separated |
| Poles | 78.6 /100 | #147 | Good 11.9% |
| Italians | 77.8 /100 | #148 | Good 11.9% |
| Immigrants | Oceania | 77.7 /100 | #149 | Good 11.9% |
| Immigrants | Portugal | 77.3 /100 | #150 | Good 11.9% |
| Czechs | 76.4 /100 | #151 | Good 11.9% |
| Immigrants | Hungary | 73.7 /100 | #152 | Good 11.9% |
| Austrians | 72.2 /100 | #153 | Good 12.0% |
| Chileans | 71.3 /100 | #154 | Good 12.0% |
| Japanese | 70.9 /100 | #155 | Good 12.0% |
| Hungarians | 70.3 /100 | #156 | Good 12.0% |
| Immigrants | Brazil | 68.8 /100 | #157 | Good 12.0% |
| Icelanders | 66.0 /100 | #158 | Good 12.0% |
| Immigrants | Barbados | 66.0 /100 | #159 | Good 12.0% |
| Immigrants | Scotland | 65.8 /100 | #160 | Good 12.0% |
| Marshallese | 64.6 /100 | #161 | Good 12.0% |