Pima vs Immigrants from Italy Currently Married

COMPARE

Pima
Race
Ancestry
AfghanAfricanAlaska NativeAlaskan AthabascanAlbanianAleutAlsatianAmericanApacheArabArapahoArgentineanArmenianAssyrian/Chaldean/SyriacAustralianAustrianBahamianBangladeshiBarbadianBasqueBelgianBelizeanBermudanBhutaneseBlackfeetBolivianBrazilianBritishBritish West IndianBulgarianBurmeseCajunCambodianCanadianCape VerdeanCarpatho RusynCelticCentral AmericanCentral American IndianCherokeeCheyenneChickasawChileanChineseChippewaChoctawColombianColvilleComancheCosta RicanCreeCreekCroatianCrowCubanCypriotCzechCzechoslovakianDanishDelawareDominicanDutchDutch West IndianEastern EuropeanEcuadorianEgyptianEnglishEstonianEthiopianEuropeanFijianFilipinoFinnishFrenchFrench American IndianFrench CanadianGermanGerman RussianGhanaianGreekGuamanian/ChamorroGuatemalanGuyaneseHaitianHmongHonduranHopiHoumaHungarianIcelanderIndian (Asian)IndonesianInupiatIranianIraqiIrishIroquoisIsraeliItalianJamaicanJapaneseJordanianKenyanKiowaKoreanLaotianLatvianLebaneseLiberianLithuanianLumbeeLuxembourgerMacedonianMalaysianMalteseMarshalleseMenomineeMexicanMexican American IndianMongolianMoroccanNative HawaiianNavajoNepaleseNew ZealanderNicaraguanNigerianNorthern EuropeanNorwegianOkinawanOsageOttawaPaiutePakistaniPalestinianPanamanianParaguayanPennsylvania GermanPeruvianPimaPolishPortuguesePotawatomiPuebloPuerto RicanPuget Sound SalishRomanianRussianSalvadoranSamoanScandinavianScotch-IrishScottishSeminoleSenegaleseSerbianShoshoneSierra LeoneanSiouxSlavicSlovakSloveneSomaliSouth AfricanSouth AmericanSouth American IndianSoviet UnionSpaniardSpanishSpanish AmericanSpanish American IndianSri LankanSubsaharan AfricanSudaneseSwedishSwissSyrianTaiwaneseThaiTlingit-HaidaTohono O'OdhamTonganTrinidadian and TobagonianTsimshianTurkishU.S. Virgin IslanderUgandanUkrainianUruguayanUteVenezuelanVietnameseWelshWest IndianYakamaYaquiYugoslavianYumanYup'ikZimbabwean
Immigration
NonimmigrantsImmigrantsAfghanistanAfricaAlbaniaArgentinaArmeniaAsiaAustraliaAustriaBahamasBangladeshBarbadosBelarusBelgiumBelizeBoliviaBosnia and HerzegovinaBrazilBulgariaBurma/MyanmarCabo VerdeCambodiaCameroonCanadaCaribbeanCentral AmericaChileChinaColombiaCongoCosta RicaCroatiaCubaCzechoslovakiaDenmarkDominicaDominican RepublicEastern AfricaEastern AsiaEastern EuropeEcuadorEgyptEl SalvadorEnglandEritreaEthiopiaEuropeFijiFranceGermanyGhanaGreeceGrenadaGuatemalaGuyanaHaitiHondurasHong KongHungaryIndiaIndonesiaIranIraqIrelandIsraelJamaicaJapanJordanKazakhstanKenyaKoreaKuwaitLaosLatin AmericaLatviaLebanonLiberiaLithuaniaMalaysiaMexicoMicronesiaMiddle AfricaMoldovaMoroccoNepalNetherlandsNicaraguaNigeriaNorth AmericaNorth MacedoniaNorthern AfricaNorthern EuropeNorwayOceaniaPakistanPanamaPeruPhilippinesPolandPortugalRomaniaRussiaSaudi ArabiaScotlandSenegalSerbiaSierra LeoneSingaporeSomaliaSouth AfricaSouth AmericaSouth Central AsiaSouth Eastern AsiaSouthern EuropeSpainSri LankaSt. Vincent and the GrenadinesSudanSwedenSwitzerlandSyriaTaiwanThailandTrinidad and TobagoTurkeyUgandaUkraineUruguayUzbekistanVenezuelaVietnamWest IndiesWestern AfricaWestern AsiaWestern EuropeYemenZaireZimbabweAzores
Immigrants from Italy
Race
Ancestry
AfghanAfricanAlaska NativeAlaskan AthabascanAlbanianAleutAlsatianAmericanApacheArabArapahoArgentineanArmenianAssyrian/Chaldean/SyriacAustralianAustrianBahamianBangladeshiBarbadianBasqueBelgianBelizeanBermudanBhutaneseBlackfeetBolivianBrazilianBritishBritish West IndianBulgarianBurmeseCajunCambodianCanadianCape VerdeanCarpatho RusynCelticCentral AmericanCentral American IndianCherokeeCheyenneChickasawChileanChineseChippewaChoctawColombianColvilleComancheCosta RicanCreeCreekCroatianCrowCubanCypriotCzechCzechoslovakianDanishDelawareDominicanDutchDutch West IndianEastern EuropeanEcuadorianEgyptianEnglishEstonianEthiopianEuropeanFijianFilipinoFinnishFrenchFrench American IndianFrench CanadianGermanGerman RussianGhanaianGreekGuamanian/ChamorroGuatemalanGuyaneseHaitianHmongHonduranHopiHoumaHungarianIcelanderIndian (Asian)IndonesianInupiatIranianIraqiIrishIroquoisIsraeliItalianJamaicanJapaneseJordanianKenyanKiowaKoreanLaotianLatvianLebaneseLiberianLithuanianLumbeeLuxembourgerMacedonianMalaysianMalteseMarshalleseMenomineeMexicanMexican American IndianMongolianMoroccanNative HawaiianNavajoNepaleseNew ZealanderNicaraguanNigerianNorthern EuropeanNorwegianOkinawanOsageOttawaPaiutePakistaniPalestinianPanamanianParaguayanPennsylvania GermanPeruvianPolishPortuguesePotawatomiPuebloPuerto RicanPuget Sound SalishRomanianRussianSalvadoranSamoanScandinavianScotch-IrishScottishSeminoleSenegaleseSerbianShoshoneSierra LeoneanSiouxSlavicSlovakSloveneSomaliSouth AfricanSouth AmericanSouth American IndianSoviet UnionSpaniardSpanishSpanish AmericanSpanish American IndianSri LankanSubsaharan AfricanSudaneseSwedishSwissSyrianTaiwaneseThaiTlingit-HaidaTohono O'OdhamTonganTrinidadian and TobagonianTsimshianTurkishU.S. Virgin IslanderUgandanUkrainianUruguayanUteVenezuelanVietnameseWelshWest IndianYakamaYaquiYugoslavianYumanYup'ikZimbabwean
Immigration
NonimmigrantsImmigrantsAfghanistanAfricaAlbaniaArgentinaArmeniaAsiaAustraliaAustriaBahamasBangladeshBarbadosBelarusBelgiumBelizeBoliviaBosnia and HerzegovinaBrazilBulgariaBurma/MyanmarCabo VerdeCambodiaCameroonCanadaCaribbeanCentral AmericaChileChinaColombiaCongoCosta RicaCroatiaCubaCzechoslovakiaDenmarkDominicaDominican RepublicEastern AfricaEastern AsiaEastern EuropeEcuadorEgyptEl SalvadorEnglandEritreaEthiopiaEuropeFijiFranceGermanyGhanaGreeceGrenadaGuatemalaGuyanaHaitiHondurasHong KongHungaryIndiaIndonesiaIranIraqIrelandIsraelItalyJamaicaJapanJordanKazakhstanKenyaKoreaKuwaitLaosLatin AmericaLatviaLebanonLiberiaLithuaniaMalaysiaMexicoMicronesiaMiddle AfricaMoldovaMoroccoNepalNetherlandsNicaraguaNigeriaNorth AmericaNorth MacedoniaNorthern AfricaNorthern EuropeNorwayOceaniaPakistanPanamaPeruPhilippinesPolandPortugalRomaniaRussiaSaudi ArabiaScotlandSenegalSerbiaSierra LeoneSingaporeSomaliaSouth AfricaSouth AmericaSouth Central AsiaSouth Eastern AsiaSouthern EuropeSpainSri LankaSt. Vincent and the GrenadinesSudanSwedenSwitzerlandSyriaTaiwanThailandTrinidad and TobagoTurkeyUgandaUkraineUruguayUzbekistanVenezuelaVietnamWest IndiesWestern AfricaWestern AsiaWestern EuropeYemenZaireZimbabweAzores
Currently Married
Income
Poverty
Unemployment
Labor Participation
Family Structure
Vehicle Availability
Education Level
Disability

Currently Married Comparison

Pima

Immigrants from Italy

Tragic
Exceptional
35.9%
CURRENTLY MARRIED
0.0/ 100
METRIC RATING
347th/ 347
METRIC RANK
47.7%
CURRENTLY MARRIED
92.9/ 100
METRIC RATING
107th/ 347
METRIC RANK

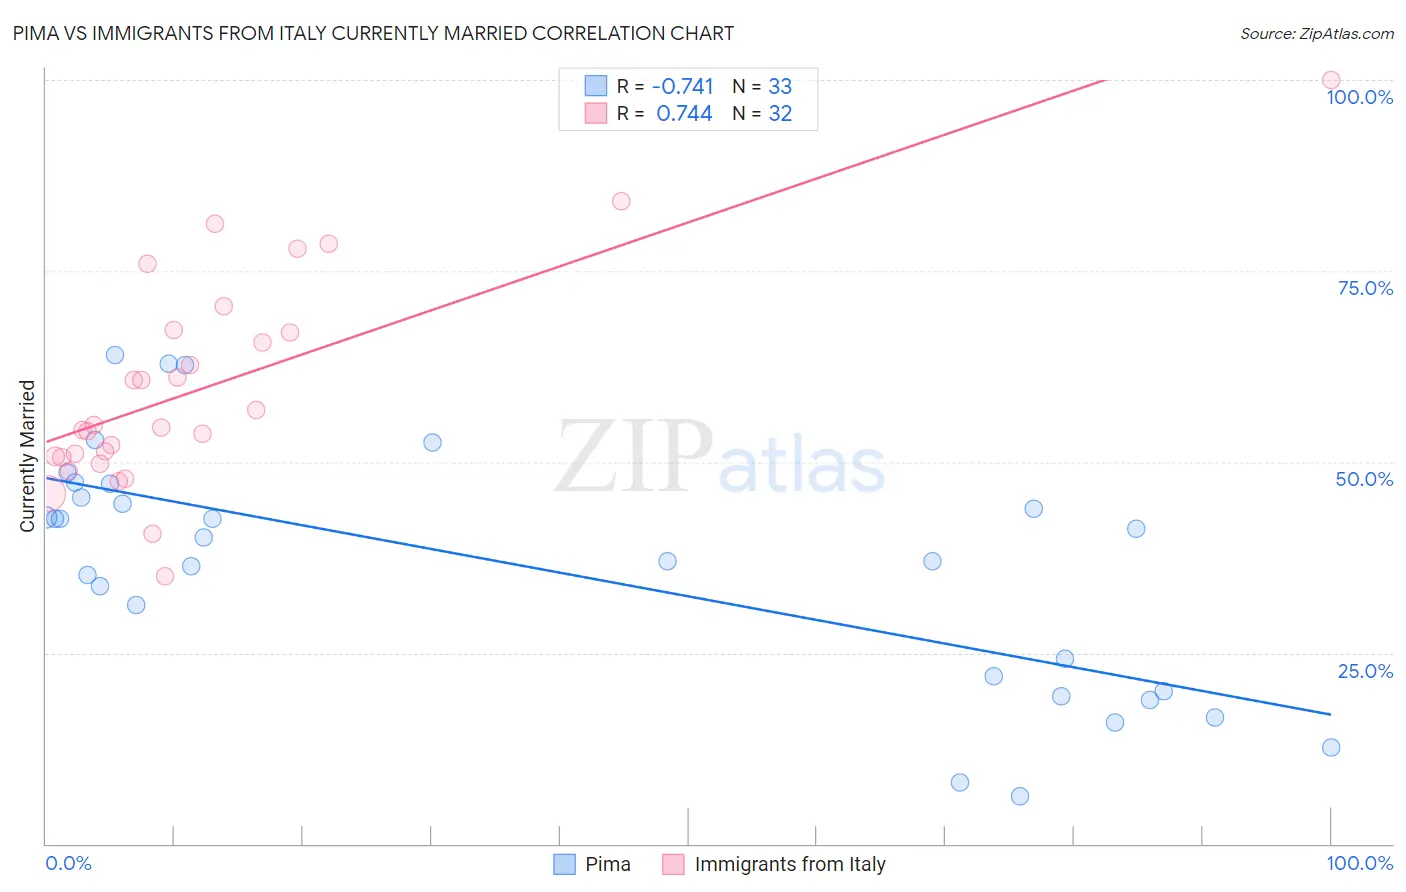
Pima vs Immigrants from Italy Currently Married Correlation Chart

The statistical analysis conducted on geographies consisting of 61,552,342 people shows a strong negative correlation between the proportion of Pima and percentage of population currently married in the United States with a correlation coefficient (R) of -0.741 and weighted average of 35.9%. Similarly, the statistical analysis conducted on geographies consisting of 324,201,882 people shows a strong positive correlation between the proportion of Immigrants from Italy and percentage of population currently married in the United States with a correlation coefficient (R) of 0.744 and weighted average of 47.7%, a difference of 32.9%.
Pima vs Immigrants from Italy Currently Married

Currently Married Correlation Summary

MeasurementPimaImmigrants from Italy
Minimum6.2%35.0%
Maximum64.0%100.0%
Range57.8%65.0%
Mean36.3%59.8%
Median40.1%54.7%
Interquartile 25% (IQ1)21.0%50.7%
Interquartile 75% (IQ3)46.2%67.1%
Interquartile Range (IQR)25.2%16.4%
Standard Deviation (Sample)15.6%14.0%
Standard Deviation (Population)15.4%13.8%

Similar Demographics by Currently Married

Demographics Similar to Pima by Currently Married

In terms of currently married, the demographic groups most similar to Pima are Hopi (36.5%, a difference of 1.8%), Tohono O'odham (36.8%, a difference of 2.4%), Immigrants from Cabo Verde (37.8%, a difference of 5.4%), Pueblo (38.2%, a difference of 6.5%), and Immigrants from Dominican Republic (38.9%, a difference of 8.4%).
DemographicsRating | RankCurrently Married
Yup'ik
0.0
/100
|
#333
Tragic
39.9%
Puerto Ricans
0.0
/100
|
#334
Tragic
39.9%
Lumbee
0.0
/100
|
#335
Tragic
39.8%
British West Indians
0.0
/100
|
#336
Tragic
39.8%
Blacks/African Americans
0.0
/100
|
#337
Tragic
39.6%
Cape Verdeans
0.0
/100
|
#338
Tragic
39.6%
Dominicans
0.0
/100
|
#339
Tragic
39.5%
Immigrants | Grenada
0.0
/100
|
#340
Tragic
39.1%
Navajo
0.0
/100
|
#341
Tragic
39.0%
Immigrants | Dominican Republic
0.0
/100
|
#342
Tragic
38.9%
Pueblo
0.0
/100
|
#343
Tragic
38.2%
Immigrants | Cabo Verde
0.0
/100
|
#344
Tragic
37.8%
Tohono O'odham
0.0
/100
|
#345
Tragic
36.8%
Hopi
0.0
/100
|
#346
Tragic
36.5%
Pima
0.0
/100
|
#347
Tragic
35.9%

Demographics Similar to Immigrants from Italy by Currently Married

In terms of currently married, the demographic groups most similar to Immigrants from Italy are Immigrants from Greece (47.7%, a difference of 0.030%), Immigrants from Singapore (47.8%, a difference of 0.060%), Tsimshian (47.7%, a difference of 0.060%), Immigrants from Egypt (47.7%, a difference of 0.080%), and Serbian (47.8%, a difference of 0.11%).
DemographicsRating | RankCurrently Married
Celtics
94.2
/100
|
#100
Exceptional
47.8%
Immigrants | Germany
94.1
/100
|
#101
Exceptional
47.8%
Turks
93.9
/100
|
#102
Exceptional
47.8%
Cypriots
93.7
/100
|
#103
Exceptional
47.8%
Serbians
93.6
/100
|
#104
Exceptional
47.8%
Immigrants | Singapore
93.3
/100
|
#105
Exceptional
47.8%
Immigrants | Greece
93.1
/100
|
#106
Exceptional
47.7%
Immigrants | Italy
92.9
/100
|
#107
Exceptional
47.7%
Tsimshian
92.4
/100
|
#108
Exceptional
47.7%
Immigrants | Egypt
92.3
/100
|
#109
Exceptional
47.7%
Immigrants | Russia
92.0
/100
|
#110
Exceptional
47.7%
Immigrants | Hungary
91.2
/100
|
#111
Exceptional
47.6%
Immigrants | Western Europe
91.1
/100
|
#112
Exceptional
47.6%
Immigrants | Denmark
90.9
/100
|
#113
Exceptional
47.6%
South Africans
90.5
/100
|
#114
Exceptional
47.6%