Pennsylvania German vs Swiss Average Family Size
COMPARE
Pennsylvania German
Swiss
Average Family Size
Average Family Size Comparison
Pennsylvania Germans
Swiss
3.19
AVERAGE FAMILY SIZE
9.3/ 100
METRIC RATING
219th/ 347
METRIC RANK
3.15
AVERAGE FAMILY SIZE
0.5/ 100
METRIC RATING
277th/ 347
METRIC RANK
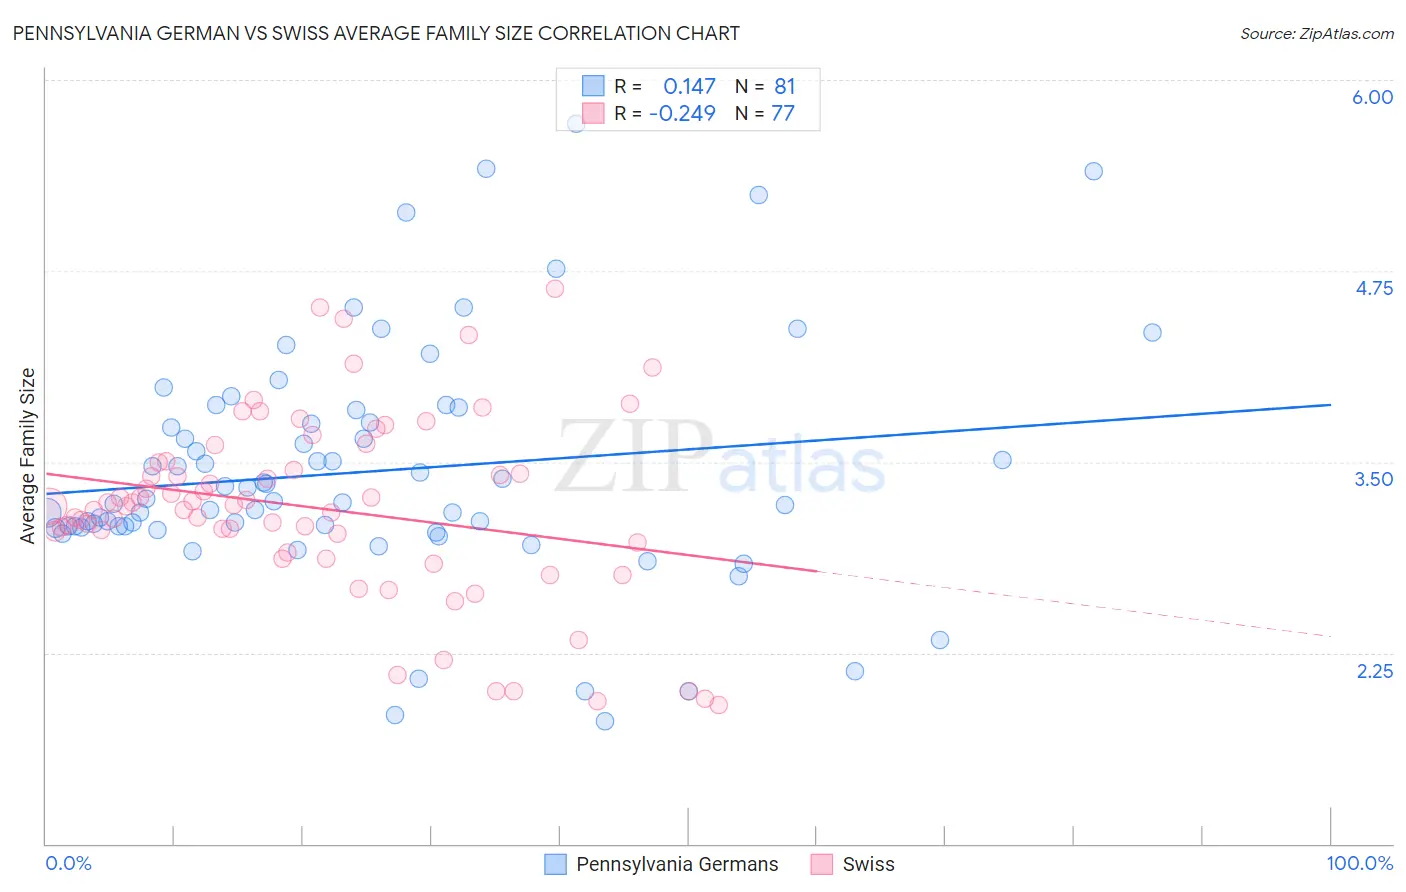
Pennsylvania German vs Swiss Average Family Size Correlation Chart
The statistical analysis conducted on geographies consisting of 234,061,809 people shows a poor positive correlation between the proportion of Pennsylvania Germans and average family size in the United States with a correlation coefficient (R) of 0.147 and weighted average of 3.19. Similarly, the statistical analysis conducted on geographies consisting of 464,761,483 people shows a weak negative correlation between the proportion of Swiss and average family size in the United States with a correlation coefficient (R) of -0.249 and weighted average of 3.15, a difference of 1.4%.
Average Family Size Correlation Summary
| Measurement | Pennsylvania German | Swiss |
| Minimum | 1.80 | 1.91 |
| Maximum | 5.71 | 4.63 |
| Range | 3.91 | 2.72 |
| Mean | 3.44 | 3.20 |
| Median | 3.24 | 3.21 |
| Interquartile 25% (IQ1) | 3.07 | 2.94 |
| Interquartile 75% (IQ3) | 3.80 | 3.50 |
| Interquartile Range (IQR) | 0.73 | 0.56 |
| Standard Deviation (Sample) | 0.78 | 0.60 |
| Standard Deviation (Population) | 0.77 | 0.60 |
Similar Demographics by Average Family Size
Demographics Similar to Pennsylvania Germans by Average Family Size
In terms of average family size, the demographic groups most similar to Pennsylvania Germans are Lebanese (3.19, a difference of 0.010%), French American Indian (3.20, a difference of 0.030%), Immigrants from Somalia (3.20, a difference of 0.050%), Delaware (3.20, a difference of 0.090%), and Bermudan (3.20, a difference of 0.090%).
| Demographics | Rating | Rank | Average Family Size |
| Creek | 12.1 /100 | #212 | Poor 3.20 |
| Mongolians | 11.5 /100 | #213 | Poor 3.20 |
| Somalis | 11.2 /100 | #214 | Poor 3.20 |
| Delaware | 11.1 /100 | #215 | Poor 3.20 |
| Bermudans | 11.0 /100 | #216 | Poor 3.20 |
| Immigrants | Somalia | 10.3 /100 | #217 | Poor 3.20 |
| French American Indians | 9.8 /100 | #218 | Tragic 3.20 |
| Pennsylvania Germans | 9.3 /100 | #219 | Tragic 3.19 |
| Lebanese | 9.1 /100 | #220 | Tragic 3.19 |
| Immigrants | Ukraine | 7.2 /100 | #221 | Tragic 3.19 |
| Immigrants | Kuwait | 7.2 /100 | #222 | Tragic 3.19 |
| Immigrants | Zimbabwe | 7.1 /100 | #223 | Tragic 3.19 |
| Syrians | 6.5 /100 | #224 | Tragic 3.19 |
| Cree | 6.2 /100 | #225 | Tragic 3.19 |
| Chickasaw | 6.0 /100 | #226 | Tragic 3.19 |
Demographics Similar to Swiss by Average Family Size
In terms of average family size, the demographic groups most similar to Swiss are Immigrants from Bosnia and Herzegovina (3.15, a difference of 0.010%), Okinawan (3.15, a difference of 0.030%), Immigrants from Europe (3.15, a difference of 0.040%), Immigrants from England (3.15, a difference of 0.070%), and New Zealander (3.15, a difference of 0.10%).
| Demographics | Rating | Rank | Average Family Size |
| Tlingit-Haida | 0.7 /100 | #270 | Tragic 3.16 |
| Immigrants | Germany | 0.7 /100 | #271 | Tragic 3.15 |
| Immigrants | Lithuania | 0.6 /100 | #272 | Tragic 3.15 |
| New Zealanders | 0.6 /100 | #273 | Tragic 3.15 |
| Immigrants | Belgium | 0.6 /100 | #274 | Tragic 3.15 |
| Cambodians | 0.6 /100 | #275 | Tragic 3.15 |
| Immigrants | Bosnia and Herzegovina | 0.5 /100 | #276 | Tragic 3.15 |
| Swiss | 0.5 /100 | #277 | Tragic 3.15 |
| Okinawans | 0.5 /100 | #278 | Tragic 3.15 |
| Immigrants | Europe | 0.5 /100 | #279 | Tragic 3.15 |
| Immigrants | England | 0.4 /100 | #280 | Tragic 3.15 |
| Immigrants | Denmark | 0.4 /100 | #281 | Tragic 3.15 |
| Yugoslavians | 0.4 /100 | #282 | Tragic 3.15 |
| German Russians | 0.4 /100 | #283 | Tragic 3.15 |
| Immigrants | France | 0.4 /100 | #284 | Tragic 3.15 |