Pennsylvania German vs Spaniard Family Households with Children
COMPARE
Pennsylvania German
Spaniard
Family Households with Children
Family Households with Children Comparison
Pennsylvania Germans
Spaniards
27.4%
FAMILY HOUSEHOLDS WITH CHILDREN
37.5/ 100
METRIC RATING
192nd/ 347
METRIC RANK
28.0%
FAMILY HOUSEHOLDS WITH CHILDREN
97.4/ 100
METRIC RATING
110th/ 347
METRIC RANK
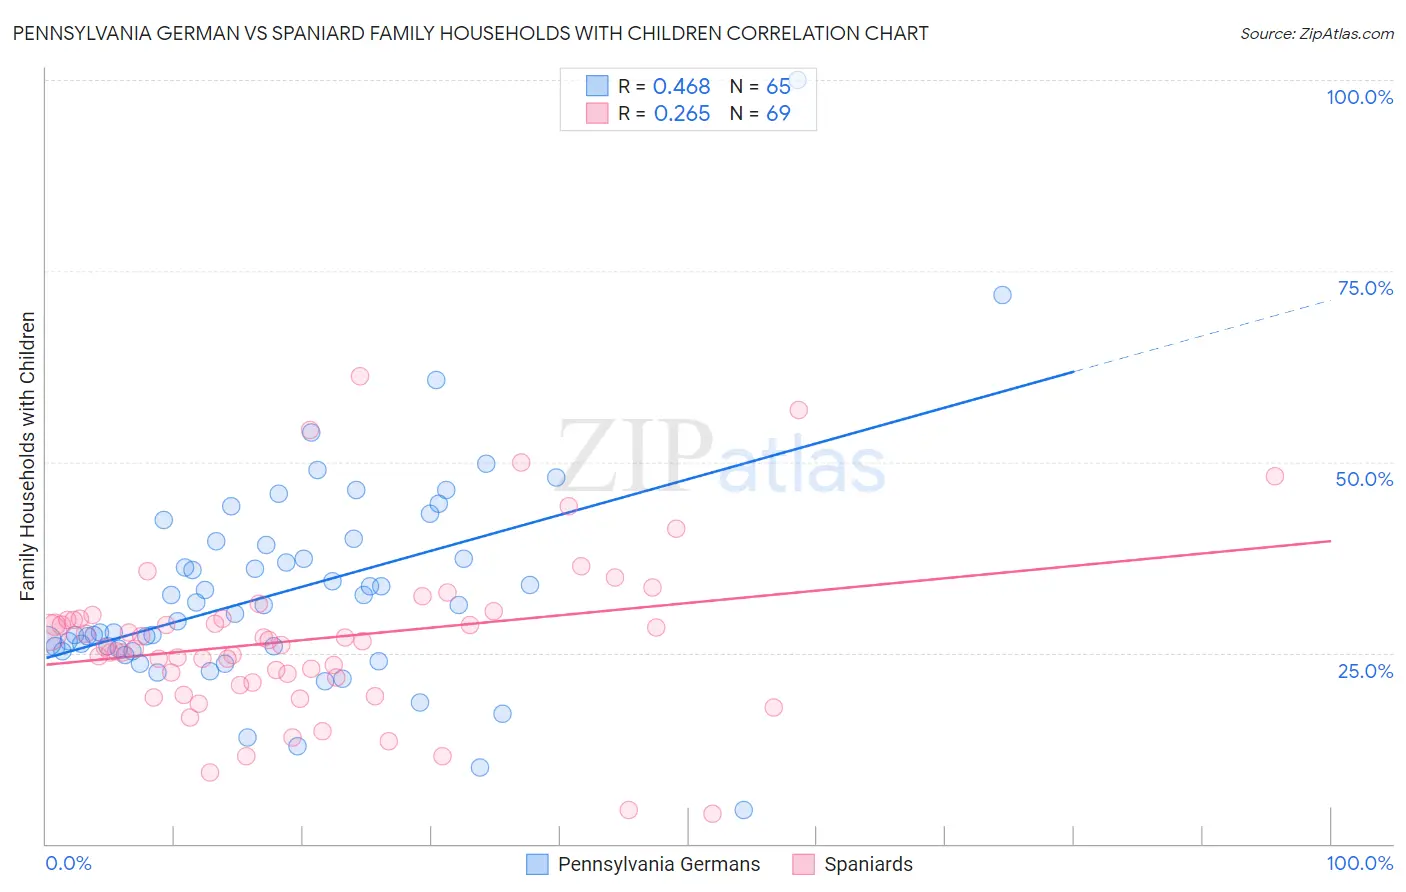
Pennsylvania German vs Spaniard Family Households with Children Correlation Chart
The statistical analysis conducted on geographies consisting of 233,961,209 people shows a moderate positive correlation between the proportion of Pennsylvania Germans and percentage of family households with children in the United States with a correlation coefficient (R) of 0.468 and weighted average of 27.4%. Similarly, the statistical analysis conducted on geographies consisting of 442,990,827 people shows a weak positive correlation between the proportion of Spaniards and percentage of family households with children in the United States with a correlation coefficient (R) of 0.265 and weighted average of 28.0%, a difference of 2.3%.
Family Households with Children Correlation Summary
| Measurement | Pennsylvania German | Spaniard |
| Minimum | 4.3% | 3.9% |
| Maximum | 100.0% | 61.2% |
| Range | 95.7% | 57.3% |
| Mean | 33.2% | 26.8% |
| Median | 31.2% | 26.1% |
| Interquartile 25% (IQ1) | 25.4% | 21.4% |
| Interquartile 75% (IQ3) | 39.4% | 29.5% |
| Interquartile Range (IQR) | 14.0% | 8.0% |
| Standard Deviation (Sample) | 14.4% | 10.7% |
| Standard Deviation (Population) | 14.3% | 10.6% |
Similar Demographics by Family Households with Children
Demographics Similar to Pennsylvania Germans by Family Households with Children
In terms of family households with children, the demographic groups most similar to Pennsylvania Germans are Immigrants from Uruguay (27.4%, a difference of 0.0%), Sudanese (27.4%, a difference of 0.0%), Immigrants from Israel (27.4%, a difference of 0.010%), Swedish (27.4%, a difference of 0.020%), and Dutch (27.4%, a difference of 0.030%).
| Demographics | Rating | Rank | Family Households with Children |
| Delaware | 42.0 /100 | #185 | Average 27.4% |
| Immigrants | Brazil | 40.6 /100 | #186 | Average 27.4% |
| Creek | 39.8 /100 | #187 | Fair 27.4% |
| Dutch | 38.8 /100 | #188 | Fair 27.4% |
| Immigrants | Israel | 37.9 /100 | #189 | Fair 27.4% |
| Immigrants | Uruguay | 37.7 /100 | #190 | Fair 27.4% |
| Sudanese | 37.6 /100 | #191 | Fair 27.4% |
| Pennsylvania Germans | 37.5 /100 | #192 | Fair 27.4% |
| Swedes | 36.9 /100 | #193 | Fair 27.4% |
| Immigrants | Iran | 36.1 /100 | #194 | Fair 27.4% |
| Crow | 35.7 /100 | #195 | Fair 27.4% |
| Cheyenne | 35.1 /100 | #196 | Fair 27.4% |
| Norwegians | 35.0 /100 | #197 | Fair 27.4% |
| Immigrants | Romania | 34.4 /100 | #198 | Fair 27.4% |
| English | 32.0 /100 | #199 | Fair 27.3% |
Demographics Similar to Spaniards by Family Households with Children
In terms of family households with children, the demographic groups most similar to Spaniards are Tohono O'odham (28.0%, a difference of 0.040%), Immigrants from Burma/Myanmar (28.0%, a difference of 0.050%), Immigrants from Uganda (28.0%, a difference of 0.060%), Scandinavian (28.0%, a difference of 0.060%), and Immigrants from Middle Africa (28.0%, a difference of 0.090%).
| Demographics | Rating | Rank | Family Households with Children |
| Palestinians | 98.5 /100 | #103 | Exceptional 28.1% |
| Sioux | 98.3 /100 | #104 | Exceptional 28.1% |
| Choctaw | 98.3 /100 | #105 | Exceptional 28.1% |
| Immigrants | South America | 98.0 /100 | #106 | Exceptional 28.0% |
| Immigrants | Uganda | 97.7 /100 | #107 | Exceptional 28.0% |
| Immigrants | Burma/Myanmar | 97.7 /100 | #108 | Exceptional 28.0% |
| Tohono O'odham | 97.6 /100 | #109 | Exceptional 28.0% |
| Spaniards | 97.4 /100 | #110 | Exceptional 28.0% |
| Scandinavians | 97.1 /100 | #111 | Exceptional 28.0% |
| Immigrants | Middle Africa | 97.0 /100 | #112 | Exceptional 28.0% |
| Arabs | 97.0 /100 | #113 | Exceptional 28.0% |
| South American Indians | 96.9 /100 | #114 | Exceptional 28.0% |
| Immigrants | Africa | 96.8 /100 | #115 | Exceptional 28.0% |
| Pakistanis | 96.0 /100 | #116 | Exceptional 27.9% |
| Immigrants | Malaysia | 95.9 /100 | #117 | Exceptional 27.9% |