Pennsylvania German vs Immigrants from South Eastern Asia Births to Unmarried Women
COMPARE
Pennsylvania German
Immigrants from South Eastern Asia
Births to Unmarried Women
Births to Unmarried Women Comparison
Pennsylvania Germans
Immigrants from South Eastern Asia
34.0%
BIRTHS TO UNMARRIED WOMEN
4.3/ 100
METRIC RATING
223rd/ 347
METRIC RANK
30.4%
BIRTHS TO UNMARRIED WOMEN
85.2/ 100
METRIC RATING
134th/ 347
METRIC RANK
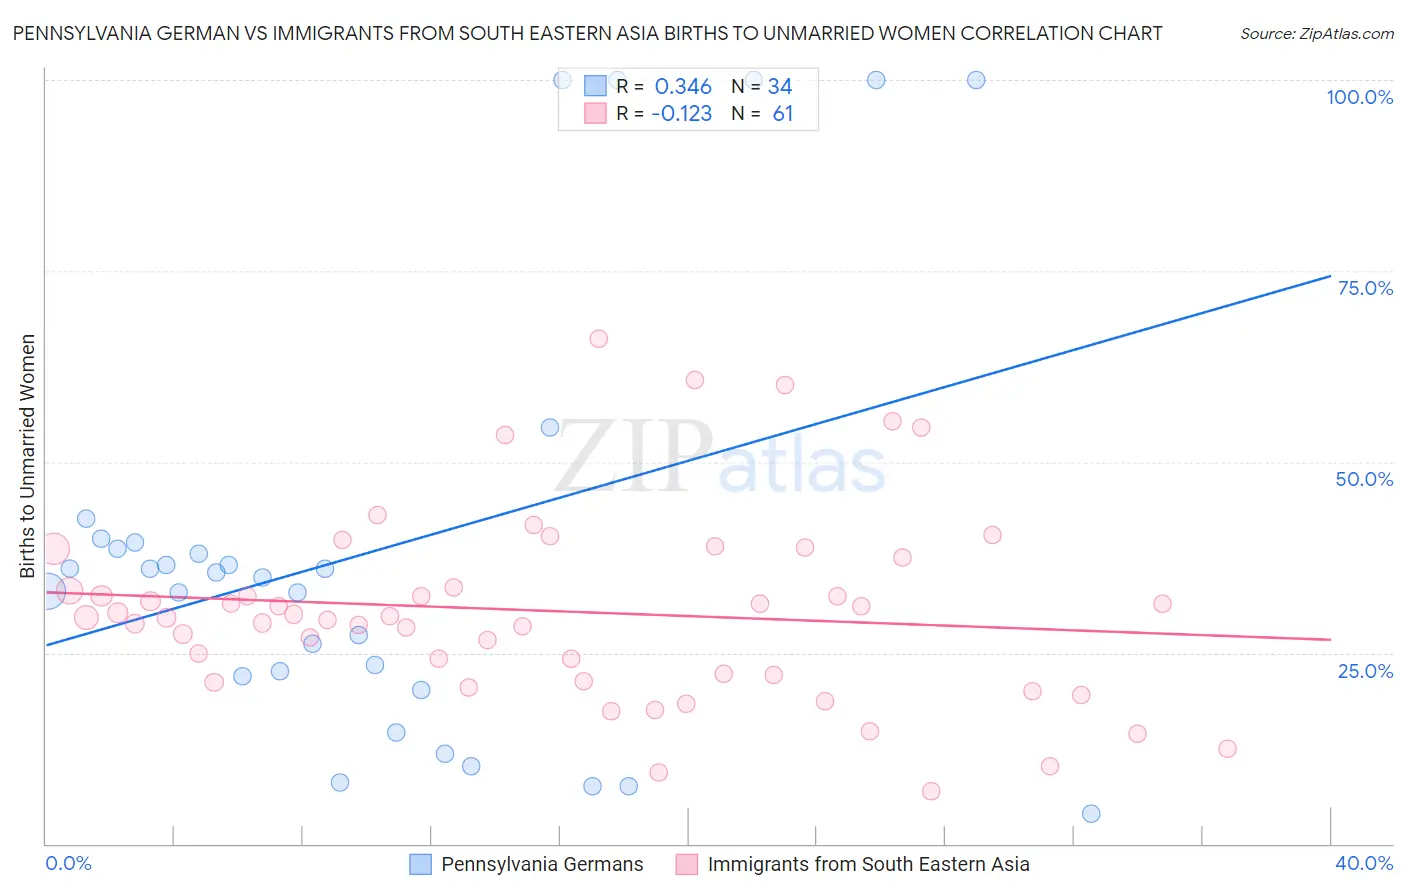
Pennsylvania German vs Immigrants from South Eastern Asia Births to Unmarried Women Correlation Chart
The statistical analysis conducted on geographies consisting of 220,469,063 people shows a mild positive correlation between the proportion of Pennsylvania Germans and percentage of births to unmarried women in the United States with a correlation coefficient (R) of 0.346 and weighted average of 34.0%. Similarly, the statistical analysis conducted on geographies consisting of 468,318,705 people shows a poor negative correlation between the proportion of Immigrants from South Eastern Asia and percentage of births to unmarried women in the United States with a correlation coefficient (R) of -0.123 and weighted average of 30.4%, a difference of 12.0%.
Births to Unmarried Women Correlation Summary
| Measurement | Pennsylvania German | Immigrants from South Eastern Asia |
| Minimum | 4.0% | 6.9% |
| Maximum | 100.0% | 66.2% |
| Range | 96.0% | 59.3% |
| Mean | 38.5% | 30.4% |
| Median | 35.2% | 29.7% |
| Interquartile 25% (IQ1) | 21.9% | 21.7% |
| Interquartile 75% (IQ3) | 39.5% | 35.4% |
| Interquartile Range (IQR) | 17.6% | 13.7% |
| Standard Deviation (Sample) | 28.5% | 12.5% |
| Standard Deviation (Population) | 28.1% | 12.4% |
Similar Demographics by Births to Unmarried Women
Demographics Similar to Pennsylvania Germans by Births to Unmarried Women
In terms of births to unmarried women, the demographic groups most similar to Pennsylvania Germans are Immigrants from Laos (34.0%, a difference of 0.0%), Spanish (34.1%, a difference of 0.17%), Immigrants from Uruguay (33.9%, a difference of 0.29%), Malaysian (33.9%, a difference of 0.35%), and Portuguese (33.8%, a difference of 0.53%).
| Demographics | Rating | Rank | Births to Unmarried Women |
| Nepalese | 7.8 /100 | #216 | Tragic 33.5% |
| Spaniards | 7.0 /100 | #217 | Tragic 33.6% |
| Immigrants | Ecuador | 5.9 /100 | #218 | Tragic 33.7% |
| Alsatians | 5.4 /100 | #219 | Tragic 33.8% |
| Portuguese | 5.4 /100 | #220 | Tragic 33.8% |
| Malaysians | 5.0 /100 | #221 | Tragic 33.9% |
| Immigrants | Uruguay | 4.8 /100 | #222 | Tragic 33.9% |
| Pennsylvania Germans | 4.3 /100 | #223 | Tragic 34.0% |
| Immigrants | Laos | 4.3 /100 | #224 | Tragic 34.0% |
| Spanish | 4.0 /100 | #225 | Tragic 34.1% |
| Delaware | 3.3 /100 | #226 | Tragic 34.2% |
| Immigrants | Panama | 3.3 /100 | #227 | Tragic 34.2% |
| Panamanians | 3.3 /100 | #228 | Tragic 34.2% |
| Immigrants | Sierra Leone | 3.1 /100 | #229 | Tragic 34.2% |
| Ghanaians | 3.1 /100 | #230 | Tragic 34.3% |
Demographics Similar to Immigrants from South Eastern Asia by Births to Unmarried Women
In terms of births to unmarried women, the demographic groups most similar to Immigrants from South Eastern Asia are Immigrants from Morocco (30.4%, a difference of 0.010%), New Zealander (30.3%, a difference of 0.060%), Brazilian (30.4%, a difference of 0.070%), Immigrants from Zimbabwe (30.3%, a difference of 0.090%), and Immigrants from Bosnia and Herzegovina (30.3%, a difference of 0.10%).
| Demographics | Rating | Rank | Births to Unmarried Women |
| Chinese | 87.1 /100 | #127 | Excellent 30.2% |
| Icelanders | 86.0 /100 | #128 | Excellent 30.3% |
| Immigrants | Spain | 85.8 /100 | #129 | Excellent 30.3% |
| Immigrants | Bosnia and Herzegovina | 85.7 /100 | #130 | Excellent 30.3% |
| Immigrants | Zimbabwe | 85.7 /100 | #131 | Excellent 30.3% |
| New Zealanders | 85.5 /100 | #132 | Excellent 30.3% |
| Immigrants | Morocco | 85.2 /100 | #133 | Excellent 30.4% |
| Immigrants | South Eastern Asia | 85.2 /100 | #134 | Excellent 30.4% |
| Brazilians | 84.8 /100 | #135 | Excellent 30.4% |
| Immigrants | Scotland | 84.6 /100 | #136 | Excellent 30.4% |
| Immigrants | Philippines | 83.9 /100 | #137 | Excellent 30.4% |
| Puget Sound Salish | 83.9 /100 | #138 | Excellent 30.4% |
| Immigrants | Canada | 83.7 /100 | #139 | Excellent 30.4% |
| Swiss | 83.1 /100 | #140 | Excellent 30.5% |
| Pakistanis | 83.0 /100 | #141 | Excellent 30.5% |