Paraguayan vs Immigrants from Oceania Family Households with Children
COMPARE
Paraguayan
Immigrants from Oceania
Family Households with Children
Family Households with Children Comparison
Paraguayans
Immigrants from Oceania
27.1%
FAMILY HOUSEHOLDS WITH CHILDREN
9.4/ 100
METRIC RATING
222nd/ 347
METRIC RANK
28.1%
FAMILY HOUSEHOLDS WITH CHILDREN
98.8/ 100
METRIC RATING
101st/ 347
METRIC RANK
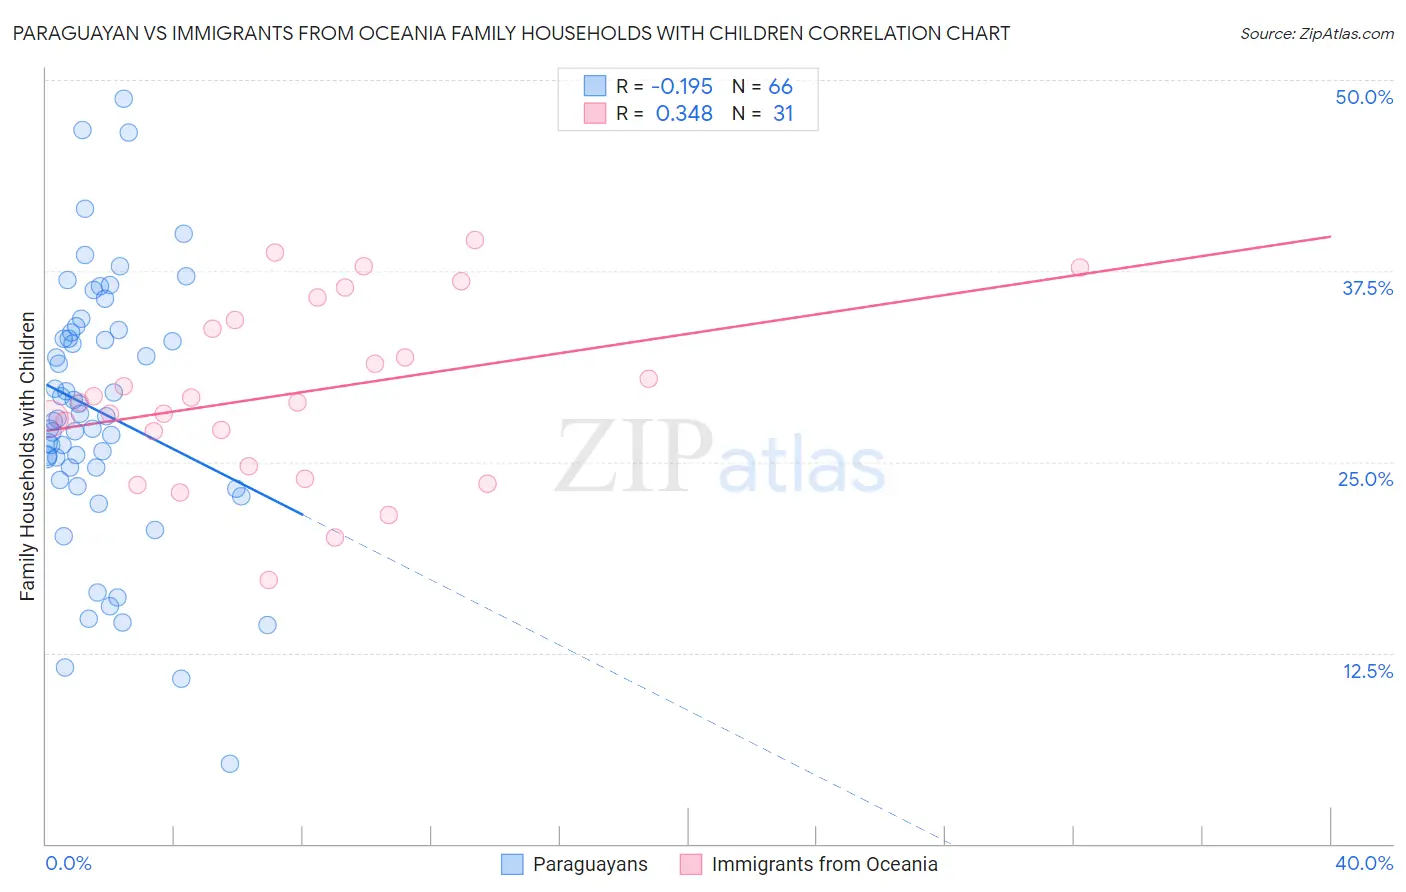
Paraguayan vs Immigrants from Oceania Family Households with Children Correlation Chart
The statistical analysis conducted on geographies consisting of 95,067,312 people shows a poor negative correlation between the proportion of Paraguayans and percentage of family households with children in the United States with a correlation coefficient (R) of -0.195 and weighted average of 27.1%. Similarly, the statistical analysis conducted on geographies consisting of 305,304,848 people shows a mild positive correlation between the proportion of Immigrants from Oceania and percentage of family households with children in the United States with a correlation coefficient (R) of 0.348 and weighted average of 28.1%, a difference of 3.7%.
Family Households with Children Correlation Summary
| Measurement | Paraguayan | Immigrants from Oceania |
| Minimum | 5.3% | 17.3% |
| Maximum | 48.8% | 39.5% |
| Range | 43.5% | 22.2% |
| Mean | 28.3% | 29.5% |
| Median | 27.9% | 28.9% |
| Interquartile 25% (IQ1) | 24.6% | 24.7% |
| Interquartile 75% (IQ3) | 33.5% | 34.3% |
| Interquartile Range (IQR) | 8.9% | 9.6% |
| Standard Deviation (Sample) | 8.6% | 5.8% |
| Standard Deviation (Population) | 8.5% | 5.7% |
Similar Demographics by Family Households with Children
Demographics Similar to Paraguayans by Family Households with Children
In terms of family households with children, the demographic groups most similar to Paraguayans are New Zealander (27.1%, a difference of 0.010%), Pima (27.1%, a difference of 0.010%), Austrian (27.1%, a difference of 0.030%), German (27.1%, a difference of 0.050%), and Immigrants from Japan (27.1%, a difference of 0.080%).
| Demographics | Rating | Rank | Family Households with Children |
| Northern Europeans | 12.8 /100 | #215 | Poor 27.2% |
| Cubans | 12.2 /100 | #216 | Poor 27.1% |
| U.S. Virgin Islanders | 12.1 /100 | #217 | Poor 27.1% |
| Greeks | 11.4 /100 | #218 | Poor 27.1% |
| Immigrants | Japan | 10.7 /100 | #219 | Poor 27.1% |
| Austrians | 9.9 /100 | #220 | Tragic 27.1% |
| New Zealanders | 9.6 /100 | #221 | Tragic 27.1% |
| Paraguayans | 9.4 /100 | #222 | Tragic 27.1% |
| Pima | 9.2 /100 | #223 | Tragic 27.1% |
| Germans | 8.7 /100 | #224 | Tragic 27.1% |
| Canadians | 7.5 /100 | #225 | Tragic 27.1% |
| Czechoslovakians | 6.6 /100 | #226 | Tragic 27.0% |
| Tsimshian | 6.6 /100 | #227 | Tragic 27.0% |
| Scottish | 6.5 /100 | #228 | Tragic 27.0% |
| Immigrants | Caribbean | 6.3 /100 | #229 | Tragic 27.0% |
Demographics Similar to Immigrants from Oceania by Family Households with Children
In terms of family households with children, the demographic groups most similar to Immigrants from Oceania are Immigrants from the Azores (28.1%, a difference of 0.020%), Indonesian (28.1%, a difference of 0.020%), Immigrants from Kenya (28.1%, a difference of 0.030%), Assyrian/Chaldean/Syriac (28.1%, a difference of 0.030%), and Chilean (28.1%, a difference of 0.080%).
| Demographics | Rating | Rank | Family Households with Children |
| Immigrants | Colombia | 99.2 /100 | #94 | Exceptional 28.2% |
| Immigrants | Nicaragua | 99.1 /100 | #95 | Exceptional 28.2% |
| Ute | 99.1 /100 | #96 | Exceptional 28.2% |
| Chileans | 98.9 /100 | #97 | Exceptional 28.1% |
| Immigrants | Kenya | 98.9 /100 | #98 | Exceptional 28.1% |
| Immigrants | Azores | 98.8 /100 | #99 | Exceptional 28.1% |
| Indonesians | 98.8 /100 | #100 | Exceptional 28.1% |
| Immigrants | Oceania | 98.8 /100 | #101 | Exceptional 28.1% |
| Assyrians/Chaldeans/Syriacs | 98.7 /100 | #102 | Exceptional 28.1% |
| Palestinians | 98.5 /100 | #103 | Exceptional 28.1% |
| Sioux | 98.3 /100 | #104 | Exceptional 28.1% |
| Choctaw | 98.3 /100 | #105 | Exceptional 28.1% |
| Immigrants | South America | 98.0 /100 | #106 | Exceptional 28.0% |
| Immigrants | Uganda | 97.7 /100 | #107 | Exceptional 28.0% |
| Immigrants | Burma/Myanmar | 97.7 /100 | #108 | Exceptional 28.0% |