Paraguayan vs Assyrian/Chaldean/Syriac Births to Unmarried Women
COMPARE
Paraguayan
Assyrian/Chaldean/Syriac
Births to Unmarried Women
Births to Unmarried Women Comparison
Paraguayans
Assyrians/Chaldeans/Syriacs
29.7%
BIRTHS TO UNMARRIED WOMEN
93.5/ 100
METRIC RATING
108th/ 347
METRIC RANK
22.0%
BIRTHS TO UNMARRIED WOMEN
100.0/ 100
METRIC RATING
1st/ 347
METRIC RANK
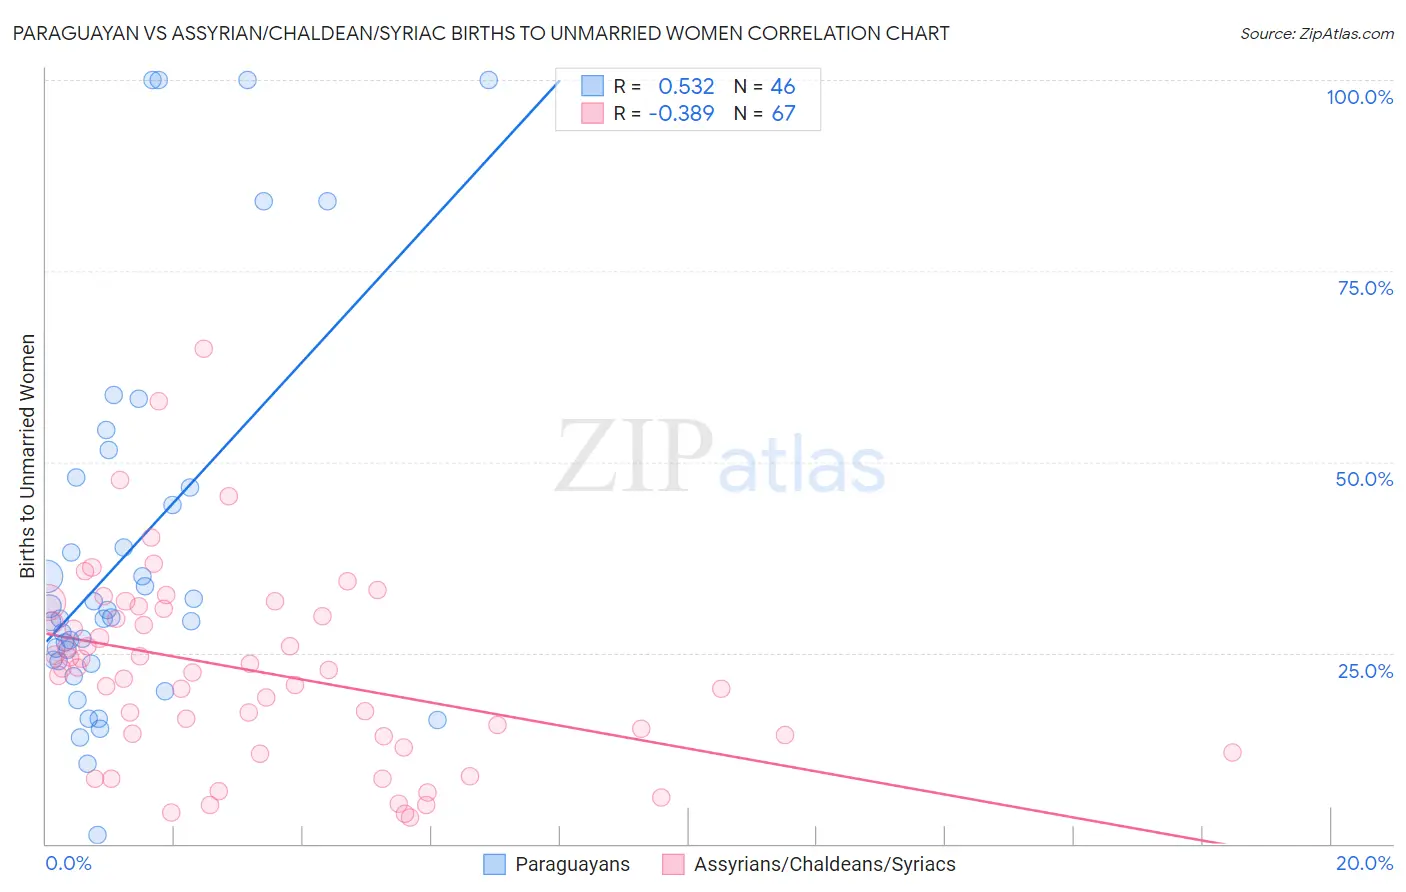
Paraguayan vs Assyrian/Chaldean/Syriac Births to Unmarried Women Correlation Chart
The statistical analysis conducted on geographies consisting of 92,447,839 people shows a substantial positive correlation between the proportion of Paraguayans and percentage of births to unmarried women in the United States with a correlation coefficient (R) of 0.532 and weighted average of 29.7%. Similarly, the statistical analysis conducted on geographies consisting of 106,724,446 people shows a mild negative correlation between the proportion of Assyrians/Chaldeans/Syriacs and percentage of births to unmarried women in the United States with a correlation coefficient (R) of -0.389 and weighted average of 22.0%, a difference of 35.1%.
Births to Unmarried Women Correlation Summary
| Measurement | Paraguayan | Assyrian/Chaldean/Syriac |
| Minimum | 1.1% | 3.5% |
| Maximum | 100.0% | 64.8% |
| Range | 98.9% | 61.3% |
| Mean | 38.3% | 22.7% |
| Median | 29.5% | 22.7% |
| Interquartile 25% (IQ1) | 23.9% | 14.0% |
| Interquartile 75% (IQ3) | 46.7% | 30.8% |
| Interquartile Range (IQR) | 22.8% | 16.8% |
| Standard Deviation (Sample) | 25.3% | 12.6% |
| Standard Deviation (Population) | 25.0% | 12.5% |
Similar Demographics by Births to Unmarried Women
Demographics Similar to Paraguayans by Births to Unmarried Women
In terms of births to unmarried women, the demographic groups most similar to Paraguayans are Greek (29.7%, a difference of 0.040%), Immigrants from Ethiopia (29.7%, a difference of 0.070%), Immigrants from Brazil (29.6%, a difference of 0.090%), Swedish (29.6%, a difference of 0.10%), and Immigrants from Hungary (29.7%, a difference of 0.20%).
| Demographics | Rating | Rank | Births to Unmarried Women |
| Immigrants | Northern Africa | 94.7 /100 | #101 | Exceptional 29.5% |
| Australians | 94.6 /100 | #102 | Exceptional 29.5% |
| Lebanese | 94.4 /100 | #103 | Exceptional 29.5% |
| Lithuanians | 94.4 /100 | #104 | Exceptional 29.6% |
| Immigrants | Nepal | 94.3 /100 | #105 | Exceptional 29.6% |
| Swedes | 93.8 /100 | #106 | Exceptional 29.6% |
| Immigrants | Brazil | 93.7 /100 | #107 | Exceptional 29.6% |
| Paraguayans | 93.5 /100 | #108 | Exceptional 29.7% |
| Greeks | 93.4 /100 | #109 | Exceptional 29.7% |
| Immigrants | Ethiopia | 93.4 /100 | #110 | Exceptional 29.7% |
| Immigrants | Hungary | 93.0 /100 | #111 | Exceptional 29.7% |
| Basques | 93.0 /100 | #112 | Exceptional 29.7% |
| Scandinavians | 92.7 /100 | #113 | Exceptional 29.8% |
| Immigrants | Croatia | 92.6 /100 | #114 | Exceptional 29.8% |
| Ethiopians | 91.9 /100 | #115 | Exceptional 29.8% |
Demographics Similar to Assyrians/Chaldeans/Syriacs by Births to Unmarried Women
In terms of births to unmarried women, the demographic groups most similar to Assyrians/Chaldeans/Syriacs are Immigrants from India (22.9%, a difference of 4.2%), Filipino (23.0%, a difference of 4.6%), Immigrants from Taiwan (23.0%, a difference of 4.7%), Immigrants from Hong Kong (23.6%, a difference of 7.3%), and Immigrants from Iran (24.0%, a difference of 9.0%).
| Demographics | Rating | Rank | Births to Unmarried Women |
| Assyrians/Chaldeans/Syriacs | 100.0 /100 | #1 | Exceptional 22.0% |
| Immigrants | India | 100.0 /100 | #2 | Exceptional 22.9% |
| Filipinos | 100.0 /100 | #3 | Exceptional 23.0% |
| Immigrants | Taiwan | 100.0 /100 | #4 | Exceptional 23.0% |
| Immigrants | Hong Kong | 100.0 /100 | #5 | Exceptional 23.6% |
| Immigrants | Iran | 100.0 /100 | #6 | Exceptional 24.0% |
| Thais | 100.0 /100 | #7 | Exceptional 24.0% |
| Immigrants | China | 100.0 /100 | #8 | Exceptional 24.7% |
| Immigrants | South Central Asia | 100.0 /100 | #9 | Exceptional 24.7% |
| Immigrants | Eastern Asia | 100.0 /100 | #10 | Exceptional 25.0% |
| Immigrants | Israel | 100.0 /100 | #11 | Exceptional 25.1% |
| Indians (Asian) | 100.0 /100 | #12 | Exceptional 25.3% |
| Iranians | 100.0 /100 | #13 | Exceptional 25.3% |
| Immigrants | Lebanon | 100.0 /100 | #14 | Exceptional 25.3% |
| Immigrants | Singapore | 100.0 /100 | #15 | Exceptional 25.6% |