Panamanian vs Immigrants from Norway Births to Unmarried Women
COMPARE
Panamanian
Immigrants from Norway
Births to Unmarried Women
Births to Unmarried Women Comparison
Panamanians
Immigrants from Norway
34.2%
BIRTHS TO UNMARRIED WOMEN
3.3/ 100
METRIC RATING
228th/ 347
METRIC RANK
29.9%
BIRTHS TO UNMARRIED WOMEN
91.0/ 100
METRIC RATING
118th/ 347
METRIC RANK
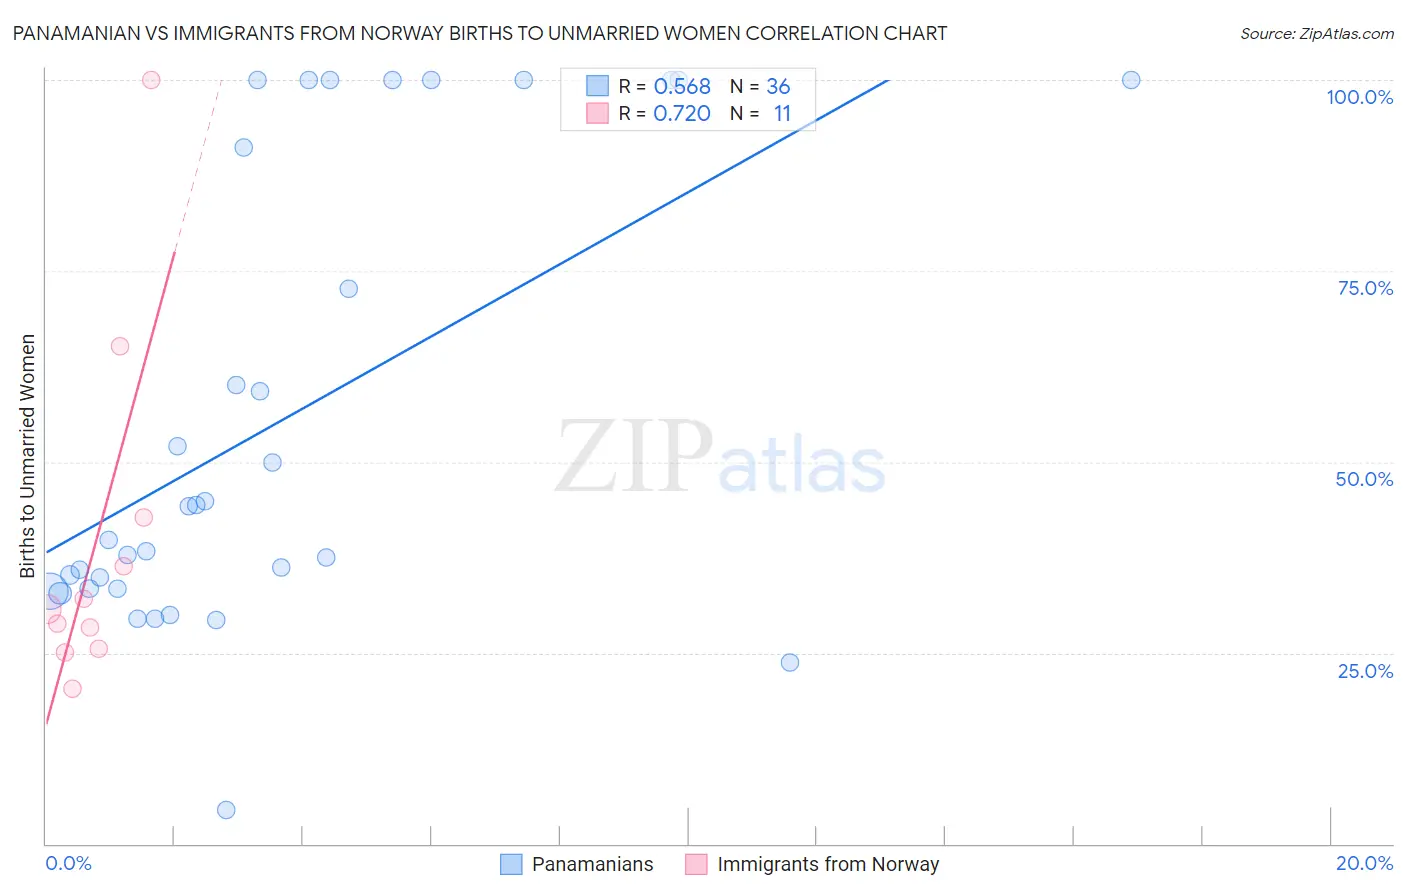
Panamanian vs Immigrants from Norway Births to Unmarried Women Correlation Chart
The statistical analysis conducted on geographies consisting of 269,712,118 people shows a substantial positive correlation between the proportion of Panamanians and percentage of births to unmarried women in the United States with a correlation coefficient (R) of 0.568 and weighted average of 34.2%. Similarly, the statistical analysis conducted on geographies consisting of 112,150,385 people shows a strong positive correlation between the proportion of Immigrants from Norway and percentage of births to unmarried women in the United States with a correlation coefficient (R) of 0.720 and weighted average of 29.9%, a difference of 14.2%.
Births to Unmarried Women Correlation Summary
| Measurement | Panamanian | Immigrants from Norway |
| Minimum | 4.5% | 20.3% |
| Maximum | 100.0% | 100.0% |
| Range | 95.5% | 79.7% |
| Mean | 55.4% | 39.6% |
| Median | 42.0% | 30.7% |
| Interquartile 25% (IQ1) | 33.4% | 25.5% |
| Interquartile 75% (IQ3) | 95.6% | 42.7% |
| Interquartile Range (IQR) | 62.2% | 17.2% |
| Standard Deviation (Sample) | 29.7% | 23.4% |
| Standard Deviation (Population) | 29.3% | 22.3% |
Similar Demographics by Births to Unmarried Women
Demographics Similar to Panamanians by Births to Unmarried Women
In terms of births to unmarried women, the demographic groups most similar to Panamanians are Immigrants from Panama (34.2%, a difference of 0.030%), Delaware (34.2%, a difference of 0.050%), Immigrants from Sierra Leone (34.2%, a difference of 0.11%), Ghanaian (34.3%, a difference of 0.13%), and Native Hawaiian (34.3%, a difference of 0.28%).
| Demographics | Rating | Rank | Births to Unmarried Women |
| Malaysians | 5.0 /100 | #221 | Tragic 33.9% |
| Immigrants | Uruguay | 4.8 /100 | #222 | Tragic 33.9% |
| Pennsylvania Germans | 4.3 /100 | #223 | Tragic 34.0% |
| Immigrants | Laos | 4.3 /100 | #224 | Tragic 34.0% |
| Spanish | 4.0 /100 | #225 | Tragic 34.1% |
| Delaware | 3.3 /100 | #226 | Tragic 34.2% |
| Immigrants | Panama | 3.3 /100 | #227 | Tragic 34.2% |
| Panamanians | 3.3 /100 | #228 | Tragic 34.2% |
| Immigrants | Sierra Leone | 3.1 /100 | #229 | Tragic 34.2% |
| Ghanaians | 3.1 /100 | #230 | Tragic 34.3% |
| Native Hawaiians | 2.9 /100 | #231 | Tragic 34.3% |
| French Canadians | 2.5 /100 | #232 | Tragic 34.4% |
| Bangladeshis | 2.5 /100 | #233 | Tragic 34.4% |
| Immigrants | Zaire | 2.3 /100 | #234 | Tragic 34.5% |
| Immigrants | Ghana | 2.2 /100 | #235 | Tragic 34.5% |
Demographics Similar to Immigrants from Norway by Births to Unmarried Women
In terms of births to unmarried women, the demographic groups most similar to Immigrants from Norway are Immigrants from Netherlands (29.9%, a difference of 0.020%), Argentinean (30.0%, a difference of 0.14%), Immigrants from Italy (29.9%, a difference of 0.23%), Ethiopian (29.8%, a difference of 0.31%), and Ugandan (30.1%, a difference of 0.50%).
| Demographics | Rating | Rank | Births to Unmarried Women |
| Immigrants | Hungary | 93.0 /100 | #111 | Exceptional 29.7% |
| Basques | 93.0 /100 | #112 | Exceptional 29.7% |
| Scandinavians | 92.7 /100 | #113 | Exceptional 29.8% |
| Immigrants | Croatia | 92.6 /100 | #114 | Exceptional 29.8% |
| Ethiopians | 91.9 /100 | #115 | Exceptional 29.8% |
| Immigrants | Italy | 91.7 /100 | #116 | Exceptional 29.9% |
| Immigrants | Netherlands | 91.1 /100 | #117 | Exceptional 29.9% |
| Immigrants | Norway | 91.0 /100 | #118 | Exceptional 29.9% |
| Argentineans | 90.5 /100 | #119 | Exceptional 30.0% |
| Ugandans | 89.2 /100 | #120 | Excellent 30.1% |
| Koreans | 88.9 /100 | #121 | Excellent 30.1% |
| Immigrants | Argentina | 88.7 /100 | #122 | Excellent 30.1% |
| Syrians | 88.2 /100 | #123 | Excellent 30.2% |
| Croatians | 88.0 /100 | #124 | Excellent 30.2% |
| Vietnamese | 87.7 /100 | #125 | Excellent 30.2% |