Panamanian vs Immigrants from Eastern Africa Divorced or Separated
COMPARE
Panamanian
Immigrants from Eastern Africa
Divorced or Separated
Divorced or Separated Comparison
Panamanians
Immigrants from Eastern Africa
12.7%
DIVORCED OR SEPARATED
0.3/ 100
METRIC RATING
271st/ 347
METRIC RANK
12.2%
DIVORCED OR SEPARATED
16.2/ 100
METRIC RATING
213th/ 347
METRIC RANK
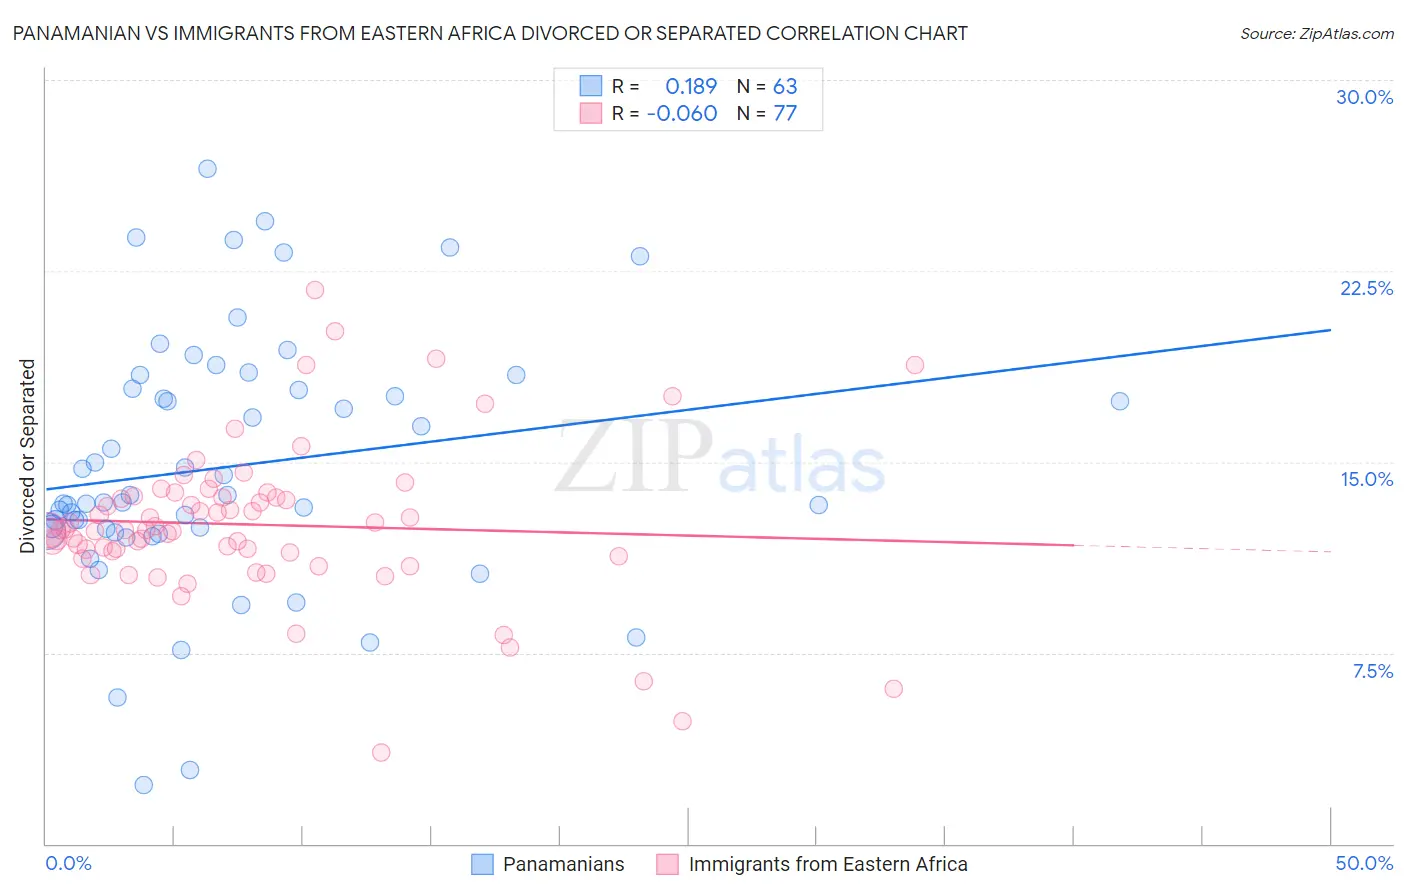
Panamanian vs Immigrants from Eastern Africa Divorced or Separated Correlation Chart
The statistical analysis conducted on geographies consisting of 281,170,767 people shows a poor positive correlation between the proportion of Panamanians and percentage of population currently divorced or separated in the United States with a correlation coefficient (R) of 0.189 and weighted average of 12.7%. Similarly, the statistical analysis conducted on geographies consisting of 355,008,096 people shows a slight negative correlation between the proportion of Immigrants from Eastern Africa and percentage of population currently divorced or separated in the United States with a correlation coefficient (R) of -0.060 and weighted average of 12.2%, a difference of 3.5%.
Divorced or Separated Correlation Summary
| Measurement | Panamanian | Immigrants from Eastern Africa |
| Minimum | 2.3% | 3.6% |
| Maximum | 26.5% | 21.8% |
| Range | 24.2% | 18.2% |
| Mean | 14.8% | 12.5% |
| Median | 13.4% | 12.3% |
| Interquartile 25% (IQ1) | 12.3% | 11.4% |
| Interquartile 75% (IQ3) | 17.9% | 13.6% |
| Interquartile Range (IQR) | 5.6% | 2.3% |
| Standard Deviation (Sample) | 5.0% | 3.0% |
| Standard Deviation (Population) | 4.9% | 3.0% |
Similar Demographics by Divorced or Separated
Demographics Similar to Panamanians by Divorced or Separated
In terms of divorced or separated, the demographic groups most similar to Panamanians are Immigrants from Middle Africa (12.7%, a difference of 0.050%), Ute (12.6%, a difference of 0.060%), Immigrants from Micronesia (12.7%, a difference of 0.16%), Immigrants from Liberia (12.6%, a difference of 0.18%), and Bermudan (12.7%, a difference of 0.18%).
| Demographics | Rating | Rank | Divorced or Separated |
| English | 0.5 /100 | #264 | Tragic 12.6% |
| Immigrants | Senegal | 0.5 /100 | #265 | Tragic 12.6% |
| Whites/Caucasians | 0.5 /100 | #266 | Tragic 12.6% |
| Scottish | 0.4 /100 | #267 | Tragic 12.6% |
| Fijians | 0.4 /100 | #268 | Tragic 12.6% |
| Immigrants | Liberia | 0.4 /100 | #269 | Tragic 12.6% |
| Ute | 0.4 /100 | #270 | Tragic 12.6% |
| Panamanians | 0.3 /100 | #271 | Tragic 12.7% |
| Immigrants | Middle Africa | 0.3 /100 | #272 | Tragic 12.7% |
| Immigrants | Micronesia | 0.3 /100 | #273 | Tragic 12.7% |
| Bermudans | 0.3 /100 | #274 | Tragic 12.7% |
| Central American Indians | 0.3 /100 | #275 | Tragic 12.7% |
| Spaniards | 0.2 /100 | #276 | Tragic 12.7% |
| Dominicans | 0.2 /100 | #277 | Tragic 12.7% |
| Lumbee | 0.2 /100 | #278 | Tragic 12.7% |
Demographics Similar to Immigrants from Eastern Africa by Divorced or Separated
In terms of divorced or separated, the demographic groups most similar to Immigrants from Eastern Africa are Immigrants from Kenya (12.2%, a difference of 0.020%), Trinidadian and Tobagonian (12.2%, a difference of 0.030%), Slavic (12.2%, a difference of 0.050%), Immigrants from Argentina (12.2%, a difference of 0.050%), and European (12.2%, a difference of 0.050%).
| Demographics | Rating | Rank | Divorced or Separated |
| Slovaks | 21.0 /100 | #206 | Fair 12.2% |
| Mexicans | 21.0 /100 | #207 | Fair 12.2% |
| Immigrants | Ghana | 18.8 /100 | #208 | Poor 12.2% |
| Immigrants | Trinidad and Tobago | 17.8 /100 | #209 | Poor 12.2% |
| Slavs | 17.0 /100 | #210 | Poor 12.2% |
| Trinidadians and Tobagonians | 16.6 /100 | #211 | Poor 12.2% |
| Immigrants | Kenya | 16.5 /100 | #212 | Poor 12.2% |
| Immigrants | Eastern Africa | 16.2 /100 | #213 | Poor 12.2% |
| Immigrants | Argentina | 15.5 /100 | #214 | Poor 12.2% |
| Europeans | 15.4 /100 | #215 | Poor 12.2% |
| Immigrants | South America | 15.4 /100 | #216 | Poor 12.2% |
| Northern Europeans | 14.7 /100 | #217 | Poor 12.2% |
| Slovenes | 13.2 /100 | #218 | Poor 12.3% |
| Czechoslovakians | 11.7 /100 | #219 | Poor 12.3% |
| British | 11.6 /100 | #220 | Poor 12.3% |