Pakistani vs New Zealander Divorced or Separated
COMPARE
Pakistani
New Zealander
Divorced or Separated
Divorced or Separated Comparison
Pakistanis
New Zealanders
11.9%
DIVORCED OR SEPARATED
81.3/ 100
METRIC RATING
143rd/ 347
METRIC RANK
11.9%
DIVORCED OR SEPARATED
87.5/ 100
METRIC RATING
133rd/ 347
METRIC RANK
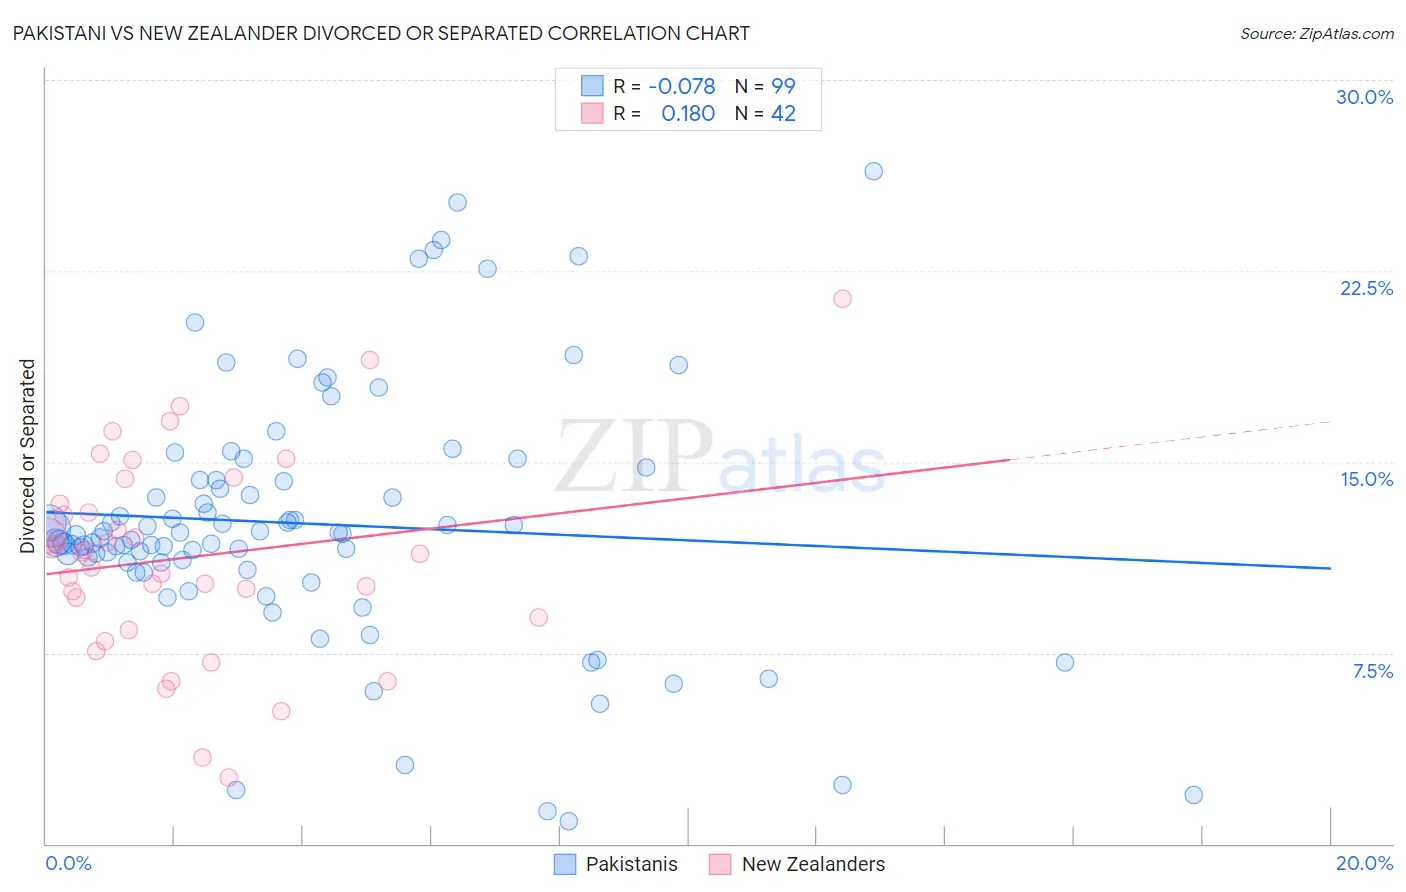
Pakistani vs New Zealander Divorced or Separated Correlation Chart
The statistical analysis conducted on geographies consisting of 335,267,594 people shows a slight negative correlation between the proportion of Pakistanis and percentage of population currently divorced or separated in the United States with a correlation coefficient (R) of -0.078 and weighted average of 11.9%. Similarly, the statistical analysis conducted on geographies consisting of 106,899,589 people shows a poor positive correlation between the proportion of New Zealanders and percentage of population currently divorced or separated in the United States with a correlation coefficient (R) of 0.180 and weighted average of 11.9%, a difference of 0.42%.
Divorced or Separated Correlation Summary
| Measurement | Pakistani | New Zealander |
| Minimum | 0.90% | 2.6% |
| Maximum | 26.4% | 21.4% |
| Range | 25.5% | 18.8% |
| Mean | 12.6% | 11.2% |
| Median | 12.1% | 11.4% |
| Interquartile 25% (IQ1) | 11.0% | 8.9% |
| Interquartile 75% (IQ3) | 14.3% | 13.4% |
| Interquartile Range (IQR) | 3.2% | 4.5% |
| Standard Deviation (Sample) | 4.9% | 4.0% |
| Standard Deviation (Population) | 4.9% | 3.9% |
Demographics Similar to Pakistanis and New Zealanders by Divorced or Separated
In terms of divorced or separated, the demographic groups most similar to Pakistanis are Immigrants from Zimbabwe (11.9%, a difference of 0.010%), Peruvian (11.9%, a difference of 0.030%), Croatian (11.9%, a difference of 0.050%), Immigrants from Morocco (11.9%, a difference of 0.090%), and Lebanese (11.9%, a difference of 0.12%). Similarly, the demographic groups most similar to New Zealanders are Immigrants from Afghanistan (11.8%, a difference of 0.030%), Immigrants from Austria (11.8%, a difference of 0.060%), Immigrants from Cambodia (11.8%, a difference of 0.060%), Immigrants from St. Vincent and the Grenadines (11.8%, a difference of 0.070%), and Immigrants from Ecuador (11.8%, a difference of 0.11%).
| Demographics | Rating | Rank | Divorced or Separated |
| Immigrants | Ecuador | 88.9 /100 | #128 | Excellent 11.8% |
| Immigrants | St. Vincent and the Grenadines | 88.4 /100 | #129 | Excellent 11.8% |
| Immigrants | Austria | 88.2 /100 | #130 | Excellent 11.8% |
| Immigrants | Cambodia | 88.2 /100 | #131 | Excellent 11.8% |
| Immigrants | Afghanistan | 87.9 /100 | #132 | Excellent 11.8% |
| New Zealanders | 87.5 /100 | #133 | Excellent 11.9% |
| Argentineans | 85.1 /100 | #134 | Excellent 11.9% |
| Danes | 84.8 /100 | #135 | Excellent 11.9% |
| Carpatho Rusyns | 84.8 /100 | #136 | Excellent 11.9% |
| Alsatians | 84.0 /100 | #137 | Excellent 11.9% |
| Immigrants | Netherlands | 83.9 /100 | #138 | Excellent 11.9% |
| Australians | 83.6 /100 | #139 | Excellent 11.9% |
| Lebanese | 83.4 /100 | #140 | Excellent 11.9% |
| Immigrants | Morocco | 82.9 /100 | #141 | Excellent 11.9% |
| Immigrants | Zimbabwe | 81.5 /100 | #142 | Excellent 11.9% |
| Pakistanis | 81.3 /100 | #143 | Excellent 11.9% |
| Peruvians | 80.9 /100 | #144 | Excellent 11.9% |
| Croatians | 80.6 /100 | #145 | Excellent 11.9% |
| Immigrants | Grenada | 79.1 /100 | #146 | Good 11.9% |
| Poles | 78.6 /100 | #147 | Good 11.9% |
| Italians | 77.8 /100 | #148 | Good 11.9% |