Ottawa vs Immigrants from Fiji Family Households
COMPARE
Ottawa
Immigrants from Fiji
Family Households
Family Households Comparison
Ottawa
Immigrants from Fiji
63.0%
FAMILY HOUSEHOLDS
0.3/ 100
METRIC RATING
277th/ 347
METRIC RANK
68.8%
FAMILY HOUSEHOLDS
100.0/ 100
METRIC RATING
8th/ 347
METRIC RANK
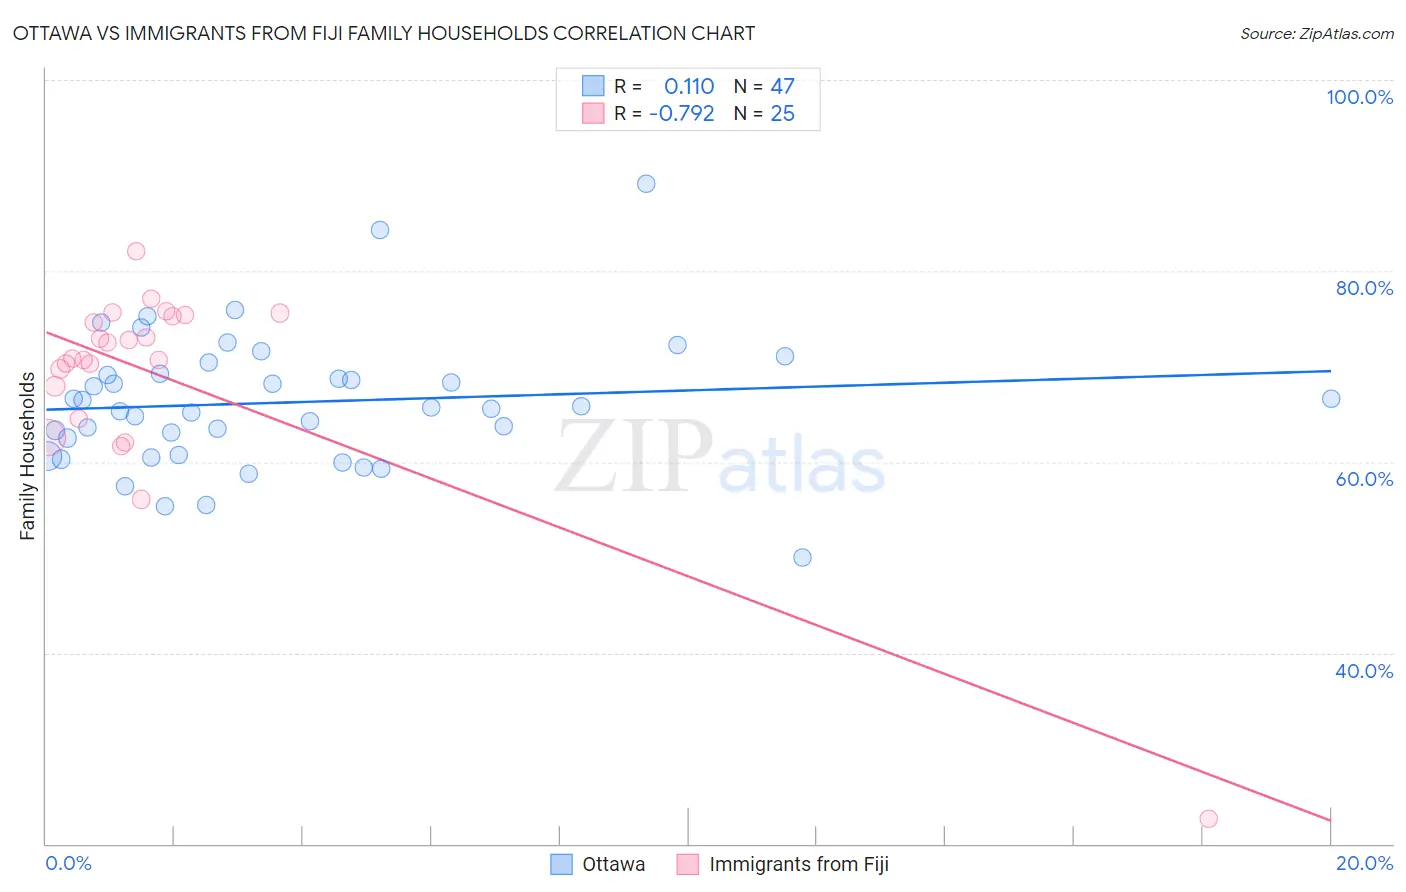
Ottawa vs Immigrants from Fiji Family Households Correlation Chart
The statistical analysis conducted on geographies consisting of 49,944,420 people shows a poor positive correlation between the proportion of Ottawa and percentage of family households in the United States with a correlation coefficient (R) of 0.110 and weighted average of 63.0%. Similarly, the statistical analysis conducted on geographies consisting of 93,754,900 people shows a strong negative correlation between the proportion of Immigrants from Fiji and percentage of family households in the United States with a correlation coefficient (R) of -0.792 and weighted average of 68.8%, a difference of 9.1%.
Family Households Correlation Summary
| Measurement | Ottawa | Immigrants from Fiji |
| Minimum | 50.0% | 22.7% |
| Maximum | 89.2% | 82.1% |
| Range | 39.2% | 59.5% |
| Mean | 66.2% | 68.9% |
| Median | 65.7% | 70.8% |
| Interquartile 25% (IQ1) | 60.7% | 66.2% |
| Interquartile 75% (IQ3) | 69.2% | 75.3% |
| Interquartile Range (IQR) | 8.6% | 9.0% |
| Standard Deviation (Sample) | 7.1% | 11.2% |
| Standard Deviation (Population) | 7.0% | 11.0% |
Similar Demographics by Family Households
Demographics Similar to Ottawa by Family Households
In terms of family households, the demographic groups most similar to Ottawa are Immigrants from Belgium (63.0%, a difference of 0.040%), Serbian (63.0%, a difference of 0.050%), Lumbee (63.1%, a difference of 0.070%), West Indian (63.1%, a difference of 0.070%), and Immigrants from Kazakhstan (63.1%, a difference of 0.080%).
| Demographics | Rating | Rank | Family Households |
| Immigrants | Austria | 0.3 /100 | #270 | Tragic 63.1% |
| Immigrants | Croatia | 0.3 /100 | #271 | Tragic 63.1% |
| Immigrants | Turkey | 0.3 /100 | #272 | Tragic 63.1% |
| Immigrants | Kazakhstan | 0.3 /100 | #273 | Tragic 63.1% |
| Lumbee | 0.3 /100 | #274 | Tragic 63.1% |
| West Indians | 0.3 /100 | #275 | Tragic 63.1% |
| Serbians | 0.3 /100 | #276 | Tragic 63.0% |
| Ottawa | 0.3 /100 | #277 | Tragic 63.0% |
| Immigrants | Belgium | 0.2 /100 | #278 | Tragic 63.0% |
| Immigrants | Yemen | 0.2 /100 | #279 | Tragic 63.0% |
| Immigrants | Bulgaria | 0.2 /100 | #280 | Tragic 63.0% |
| Estonians | 0.2 /100 | #281 | Tragic 62.9% |
| New Zealanders | 0.1 /100 | #282 | Tragic 62.9% |
| Immigrants | Denmark | 0.1 /100 | #283 | Tragic 62.9% |
| Australians | 0.1 /100 | #284 | Tragic 62.8% |
Demographics Similar to Immigrants from Fiji by Family Households
In terms of family households, the demographic groups most similar to Immigrants from Fiji are Mexican (69.0%, a difference of 0.32%), Immigrants from Mexico (69.1%, a difference of 0.53%), Native Hawaiian (68.4%, a difference of 0.56%), Immigrants from Philippines (68.3%, a difference of 0.63%), and Immigrants from Central America (68.3%, a difference of 0.70%).
| Demographics | Rating | Rank | Family Households |
| Yup'ik | 100 /100 | #1 | Exceptional 72.4% |
| Spanish American Indians | 100.0 /100 | #2 | Exceptional 71.2% |
| Tongans | 100.0 /100 | #3 | Exceptional 69.6% |
| Yakama | 100.0 /100 | #4 | Exceptional 69.3% |
| Yuman | 100.0 /100 | #5 | Exceptional 69.3% |
| Immigrants | Mexico | 100.0 /100 | #6 | Exceptional 69.1% |
| Mexicans | 100.0 /100 | #7 | Exceptional 69.0% |
| Immigrants | Fiji | 100.0 /100 | #8 | Exceptional 68.8% |
| Native Hawaiians | 100.0 /100 | #9 | Exceptional 68.4% |
| Immigrants | Philippines | 100.0 /100 | #10 | Exceptional 68.3% |
| Immigrants | Central America | 100.0 /100 | #11 | Exceptional 68.3% |
| Koreans | 100.0 /100 | #12 | Exceptional 68.3% |
| Pueblo | 100.0 /100 | #13 | Exceptional 68.2% |
| Immigrants | Cuba | 100.0 /100 | #14 | Exceptional 68.2% |
| Assyrians/Chaldeans/Syriacs | 100.0 /100 | #15 | Exceptional 68.2% |