Okinawan vs Immigrants from Turkey Family Households
COMPARE
Okinawan
Immigrants from Turkey
Family Households
Family Households Comparison
Okinawans
Immigrants from Turkey
62.5%
FAMILY HOUSEHOLDS
0.0/ 100
METRIC RATING
295th/ 347
METRIC RANK
63.1%
FAMILY HOUSEHOLDS
0.3/ 100
METRIC RATING
272nd/ 347
METRIC RANK
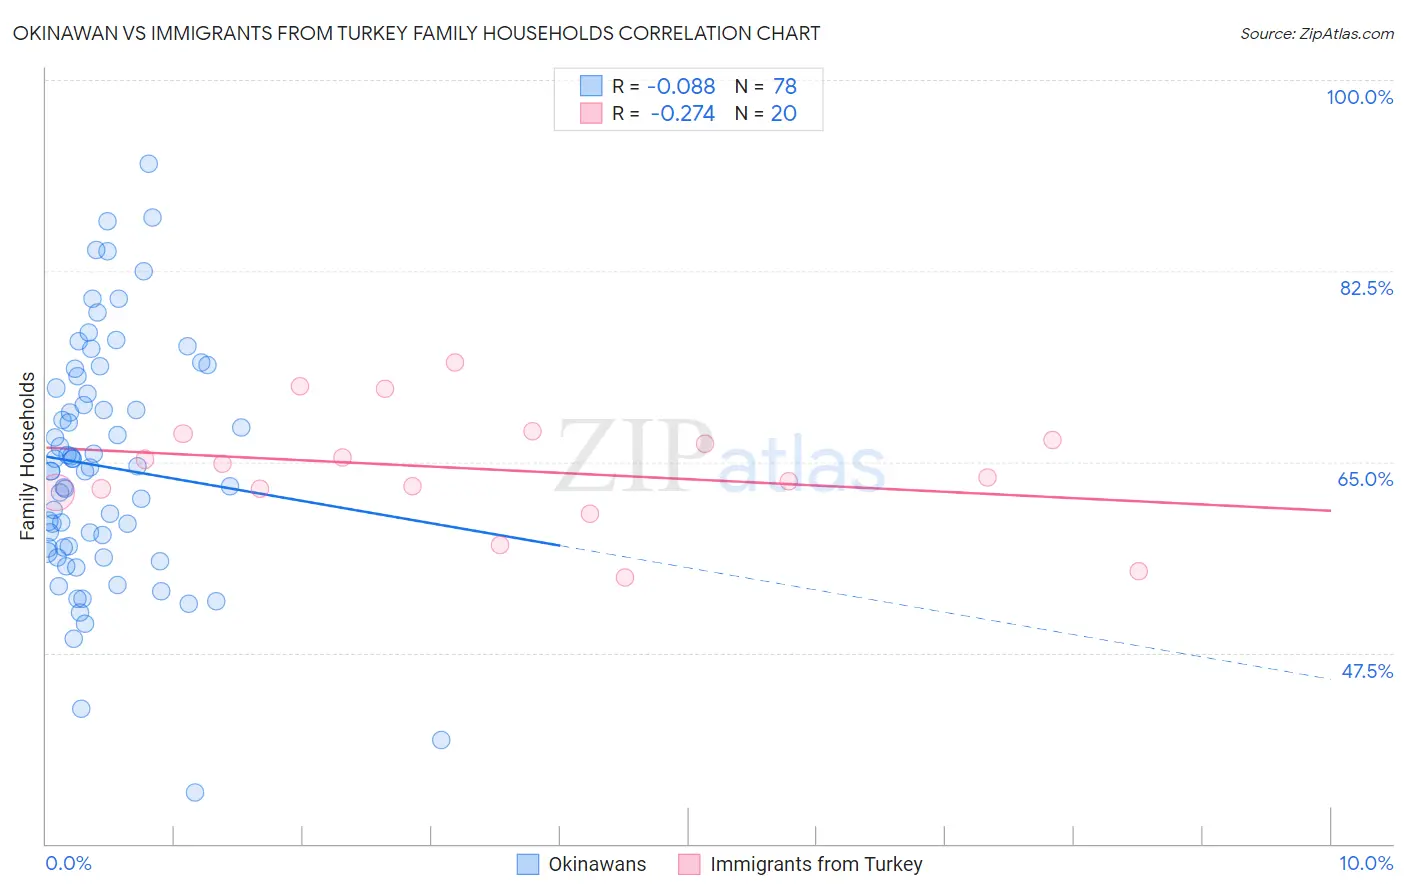
Okinawan vs Immigrants from Turkey Family Households Correlation Chart
The statistical analysis conducted on geographies consisting of 73,730,416 people shows a slight negative correlation between the proportion of Okinawans and percentage of family households in the United States with a correlation coefficient (R) of -0.088 and weighted average of 62.5%. Similarly, the statistical analysis conducted on geographies consisting of 222,976,596 people shows a weak negative correlation between the proportion of Immigrants from Turkey and percentage of family households in the United States with a correlation coefficient (R) of -0.274 and weighted average of 63.1%, a difference of 0.99%.
Family Households Correlation Summary
| Measurement | Okinawan | Immigrants from Turkey |
| Minimum | 34.7% | 54.4% |
| Maximum | 92.3% | 74.1% |
| Range | 57.6% | 19.7% |
| Mean | 64.6% | 64.3% |
| Median | 64.3% | 64.2% |
| Interquartile 25% (IQ1) | 57.1% | 62.4% |
| Interquartile 75% (IQ3) | 71.8% | 67.3% |
| Interquartile Range (IQR) | 14.6% | 4.9% |
| Standard Deviation (Sample) | 11.1% | 5.2% |
| Standard Deviation (Population) | 11.0% | 5.1% |
Similar Demographics by Family Households
Demographics Similar to Okinawans by Family Households
In terms of family households, the demographic groups most similar to Okinawans are Barbadian (62.5%, a difference of 0.010%), Slovene (62.4%, a difference of 0.010%), French American Indian (62.4%, a difference of 0.020%), Immigrants from Spain (62.4%, a difference of 0.050%), and Immigrants from Sweden (62.5%, a difference of 0.080%).
| Demographics | Rating | Rank | Family Households |
| Immigrants | Uganda | 0.1 /100 | #288 | Tragic 62.7% |
| Immigrants | Nepal | 0.1 /100 | #289 | Tragic 62.7% |
| Immigrants | Grenada | 0.0 /100 | #290 | Tragic 62.6% |
| U.S. Virgin Islanders | 0.0 /100 | #291 | Tragic 62.6% |
| Immigrants | Burma/Myanmar | 0.0 /100 | #292 | Tragic 62.6% |
| Immigrants | Sweden | 0.0 /100 | #293 | Tragic 62.5% |
| Barbadians | 0.0 /100 | #294 | Tragic 62.5% |
| Okinawans | 0.0 /100 | #295 | Tragic 62.5% |
| Slovenes | 0.0 /100 | #296 | Tragic 62.4% |
| French American Indians | 0.0 /100 | #297 | Tragic 62.4% |
| Immigrants | Spain | 0.0 /100 | #298 | Tragic 62.4% |
| Immigrants | Kuwait | 0.0 /100 | #299 | Tragic 62.4% |
| Immigrants | Africa | 0.0 /100 | #300 | Tragic 62.4% |
| Immigrants | Albania | 0.0 /100 | #301 | Tragic 62.4% |
| Immigrants | Kenya | 0.0 /100 | #302 | Tragic 62.3% |
Demographics Similar to Immigrants from Turkey by Family Households
In terms of family households, the demographic groups most similar to Immigrants from Turkey are Immigrants from Croatia (63.1%, a difference of 0.0%), Immigrants from Austria (63.1%, a difference of 0.010%), Immigrants from Kazakhstan (63.1%, a difference of 0.010%), Lumbee (63.1%, a difference of 0.020%), and West Indian (63.1%, a difference of 0.020%).
| Demographics | Rating | Rank | Family Households |
| Colville | 0.5 /100 | #265 | Tragic 63.2% |
| Immigrants | Western Africa | 0.5 /100 | #266 | Tragic 63.1% |
| Israelis | 0.4 /100 | #267 | Tragic 63.1% |
| Immigrants | Singapore | 0.4 /100 | #268 | Tragic 63.1% |
| Yugoslavians | 0.4 /100 | #269 | Tragic 63.1% |
| Immigrants | Austria | 0.3 /100 | #270 | Tragic 63.1% |
| Immigrants | Croatia | 0.3 /100 | #271 | Tragic 63.1% |
| Immigrants | Turkey | 0.3 /100 | #272 | Tragic 63.1% |
| Immigrants | Kazakhstan | 0.3 /100 | #273 | Tragic 63.1% |
| Lumbee | 0.3 /100 | #274 | Tragic 63.1% |
| West Indians | 0.3 /100 | #275 | Tragic 63.1% |
| Serbians | 0.3 /100 | #276 | Tragic 63.0% |
| Ottawa | 0.3 /100 | #277 | Tragic 63.0% |
| Immigrants | Belgium | 0.2 /100 | #278 | Tragic 63.0% |
| Immigrants | Yemen | 0.2 /100 | #279 | Tragic 63.0% |