Northern European vs Immigrants from Caribbean Single Mother Households
COMPARE
Northern European
Immigrants from Caribbean
Single Mother Households
Single Mother Households Comparison
Northern Europeans
Immigrants from Caribbean
5.8%
SINGLE MOTHER HOUSEHOLDS
96.2/ 100
METRIC RATING
104th/ 347
METRIC RANK
8.4%
SINGLE MOTHER HOUSEHOLDS
0.0/ 100
METRIC RATING
325th/ 347
METRIC RANK
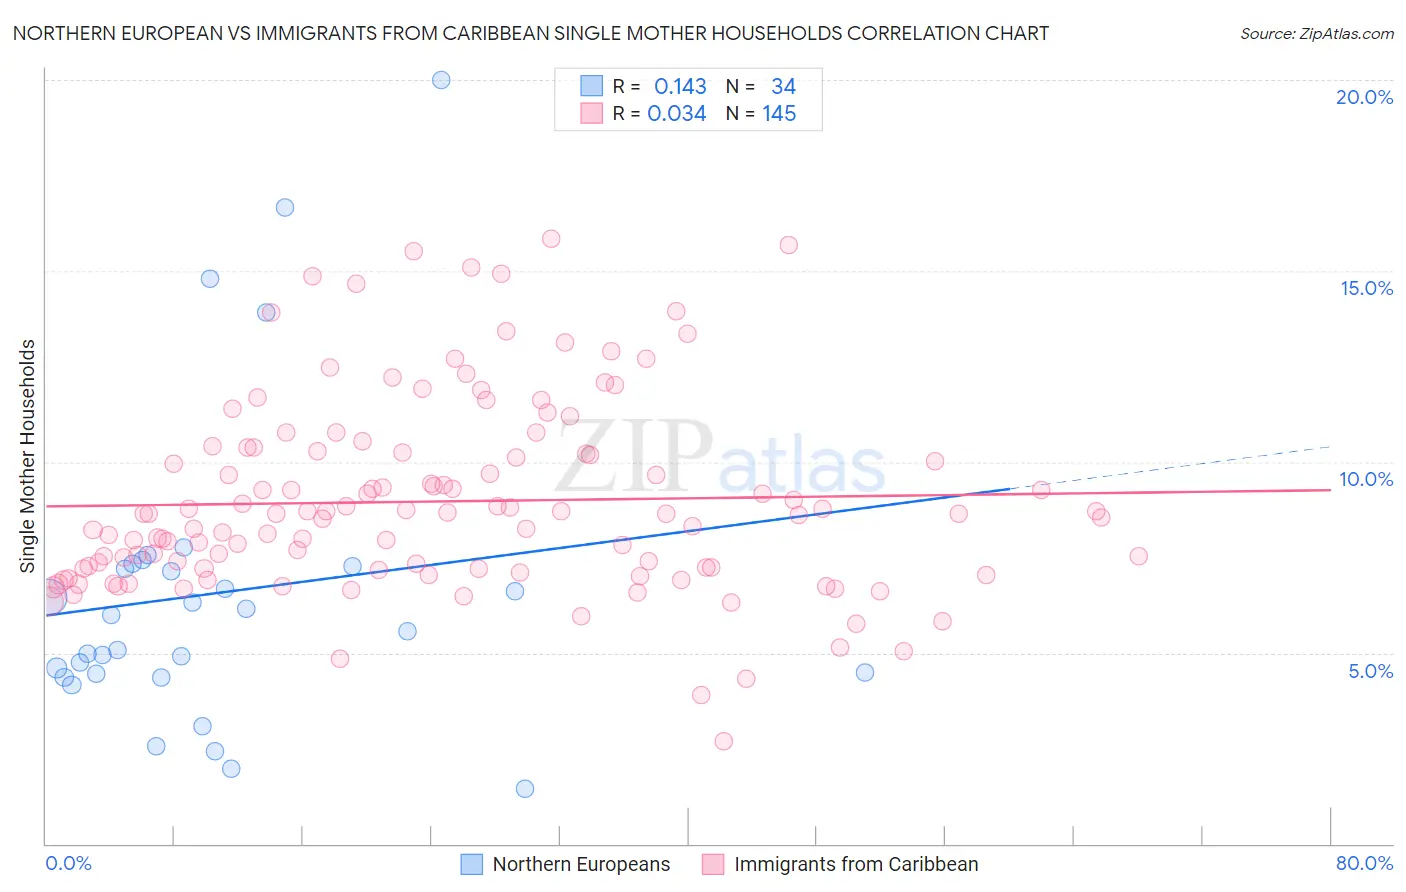
Northern European vs Immigrants from Caribbean Single Mother Households Correlation Chart
The statistical analysis conducted on geographies consisting of 404,583,637 people shows a poor positive correlation between the proportion of Northern Europeans and percentage of single mother households in the United States with a correlation coefficient (R) of 0.143 and weighted average of 5.8%. Similarly, the statistical analysis conducted on geographies consisting of 448,351,427 people shows no correlation between the proportion of Immigrants from Caribbean and percentage of single mother households in the United States with a correlation coefficient (R) of 0.034 and weighted average of 8.4%, a difference of 45.5%.
Single Mother Households Correlation Summary
| Measurement | Northern European | Immigrants from Caribbean |
| Minimum | 1.5% | 2.7% |
| Maximum | 20.0% | 15.8% |
| Range | 18.5% | 13.1% |
| Mean | 6.6% | 9.0% |
| Median | 5.8% | 8.6% |
| Interquartile 25% (IQ1) | 4.5% | 7.2% |
| Interquartile 75% (IQ3) | 7.3% | 10.3% |
| Interquartile Range (IQR) | 2.8% | 3.1% |
| Standard Deviation (Sample) | 4.1% | 2.5% |
| Standard Deviation (Population) | 4.0% | 2.5% |
Similar Demographics by Single Mother Households
Demographics Similar to Northern Europeans by Single Mother Households
In terms of single mother households, the demographic groups most similar to Northern Europeans are Scottish (5.8%, a difference of 0.010%), English (5.8%, a difference of 0.020%), German (5.8%, a difference of 0.030%), Scandinavian (5.8%, a difference of 0.060%), and Immigrants from Poland (5.8%, a difference of 0.070%).
| Demographics | Rating | Rank | Single Mother Households |
| Tlingit-Haida | 96.4 /100 | #97 | Exceptional 5.7% |
| Immigrants | South Africa | 96.3 /100 | #98 | Exceptional 5.7% |
| Immigrants | Poland | 96.3 /100 | #99 | Exceptional 5.8% |
| Scandinavians | 96.2 /100 | #100 | Exceptional 5.8% |
| Germans | 96.2 /100 | #101 | Exceptional 5.8% |
| English | 96.2 /100 | #102 | Exceptional 5.8% |
| Scottish | 96.2 /100 | #103 | Exceptional 5.8% |
| Northern Europeans | 96.2 /100 | #104 | Exceptional 5.8% |
| Taiwanese | 96.1 /100 | #105 | Exceptional 5.8% |
| Immigrants | Ukraine | 95.9 /100 | #106 | Exceptional 5.8% |
| Paraguayans | 95.8 /100 | #107 | Exceptional 5.8% |
| Immigrants | Italy | 95.8 /100 | #108 | Exceptional 5.8% |
| Immigrants | Western Europe | 95.7 /100 | #109 | Exceptional 5.8% |
| British | 95.5 /100 | #110 | Exceptional 5.8% |
| Immigrants | England | 95.5 /100 | #111 | Exceptional 5.8% |
Demographics Similar to Immigrants from Caribbean by Single Mother Households
In terms of single mother households, the demographic groups most similar to Immigrants from Caribbean are British West Indian (8.4%, a difference of 0.12%), Immigrants from Jamaica (8.4%, a difference of 0.18%), Immigrants from Haiti (8.4%, a difference of 0.27%), Yakama (8.4%, a difference of 0.45%), and Haitian (8.3%, a difference of 0.61%).
| Demographics | Rating | Rank | Single Mother Households |
| Senegalese | 0.0 /100 | #318 | Tragic 8.2% |
| Jamaicans | 0.0 /100 | #319 | Tragic 8.2% |
| Bahamians | 0.0 /100 | #320 | Tragic 8.3% |
| Immigrants | Senegal | 0.0 /100 | #321 | Tragic 8.3% |
| Pima | 0.0 /100 | #322 | Tragic 8.3% |
| Haitians | 0.0 /100 | #323 | Tragic 8.3% |
| Immigrants | Jamaica | 0.0 /100 | #324 | Tragic 8.4% |
| Immigrants | Caribbean | 0.0 /100 | #325 | Tragic 8.4% |
| British West Indians | 0.0 /100 | #326 | Tragic 8.4% |
| Immigrants | Haiti | 0.0 /100 | #327 | Tragic 8.4% |
| Yakama | 0.0 /100 | #328 | Tragic 8.4% |
| Hopi | 0.0 /100 | #329 | Tragic 8.5% |
| Inupiat | 0.0 /100 | #330 | Tragic 8.5% |
| Sioux | 0.0 /100 | #331 | Tragic 8.5% |
| U.S. Virgin Islanders | 0.0 /100 | #332 | Tragic 8.6% |