Northern European vs Chinese Currently Married
COMPARE
Northern European
Chinese
Currently Married
Currently Married Comparison
Northern Europeans
Chinese
48.7%
CURRENTLY MARRIED
99.2/ 100
METRIC RATING
47th/ 347
METRIC RANK
49.5%
CURRENTLY MARRIED
99.9/ 100
METRIC RATING
16th/ 347
METRIC RANK
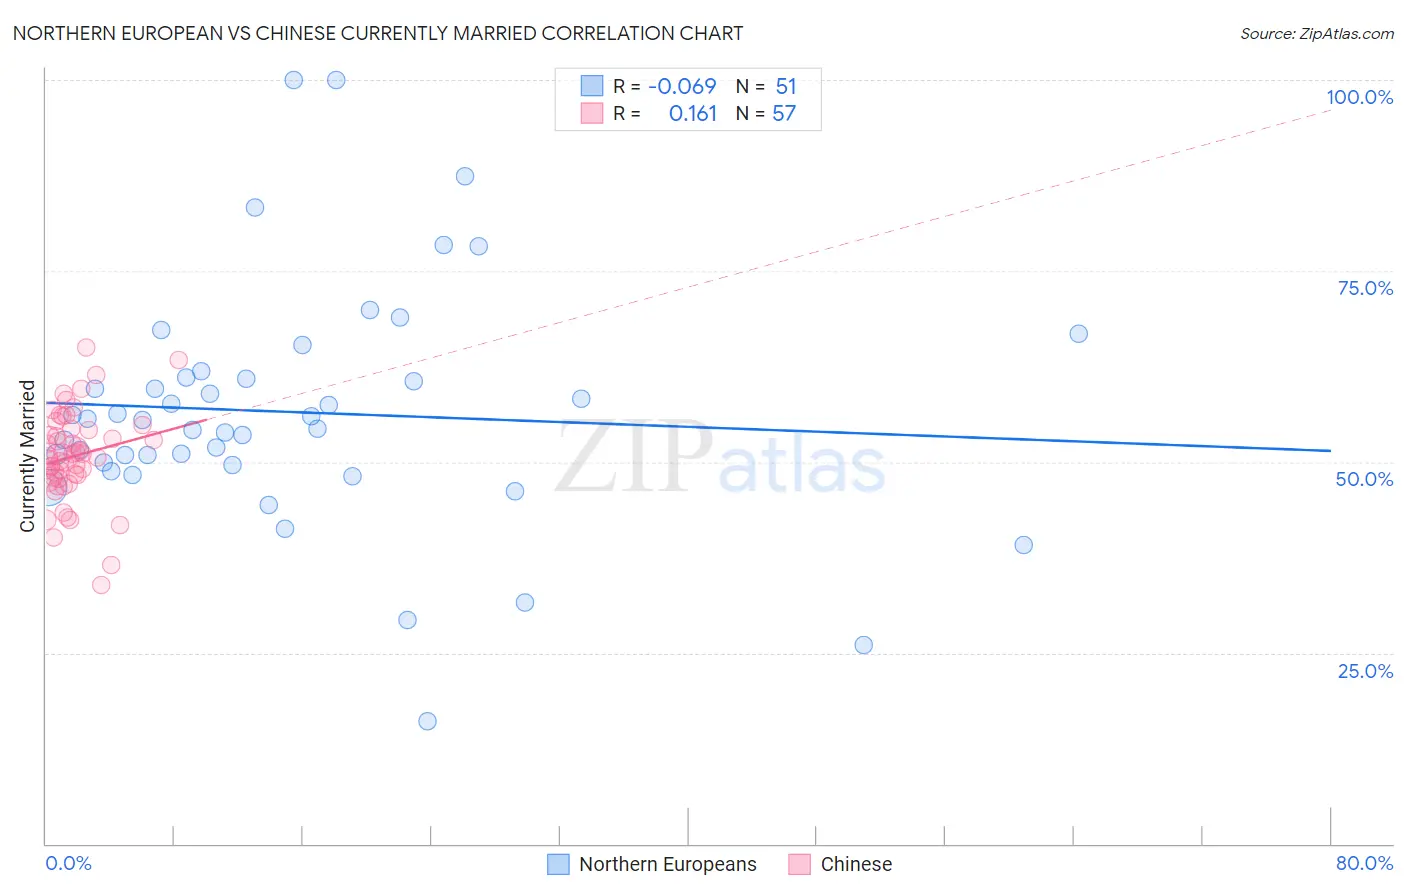
Northern European vs Chinese Currently Married Correlation Chart
The statistical analysis conducted on geographies consisting of 406,072,050 people shows a slight negative correlation between the proportion of Northern Europeans and percentage of population currently married in the United States with a correlation coefficient (R) of -0.069 and weighted average of 48.7%. Similarly, the statistical analysis conducted on geographies consisting of 64,808,439 people shows a poor positive correlation between the proportion of Chinese and percentage of population currently married in the United States with a correlation coefficient (R) of 0.161 and weighted average of 49.5%, a difference of 1.6%.
Currently Married Correlation Summary
| Measurement | Northern European | Chinese |
| Minimum | 16.1% | 33.8% |
| Maximum | 100.0% | 64.9% |
| Range | 83.9% | 31.1% |
| Mean | 56.5% | 50.7% |
| Median | 55.5% | 50.7% |
| Interquartile 25% (IQ1) | 49.5% | 47.9% |
| Interquartile 75% (IQ3) | 61.1% | 54.3% |
| Interquartile Range (IQR) | 11.6% | 6.4% |
| Standard Deviation (Sample) | 15.8% | 6.0% |
| Standard Deviation (Population) | 15.6% | 5.9% |
Similar Demographics by Currently Married
Demographics Similar to Northern Europeans by Currently Married
In terms of currently married, the demographic groups most similar to Northern Europeans are Immigrants from Iran (48.7%, a difference of 0.010%), Austrian (48.7%, a difference of 0.010%), Belgian (48.7%, a difference of 0.040%), Immigrants from North America (48.7%, a difference of 0.060%), and Scotch-Irish (48.7%, a difference of 0.090%).
| Demographics | Rating | Rank | Currently Married |
| Immigrants | Canada | 99.4 /100 | #40 | Exceptional 48.8% |
| Greeks | 99.3 /100 | #41 | Exceptional 48.8% |
| Finns | 99.3 /100 | #42 | Exceptional 48.8% |
| Scotch-Irish | 99.3 /100 | #43 | Exceptional 48.7% |
| Immigrants | North America | 99.3 /100 | #44 | Exceptional 48.7% |
| Belgians | 99.3 /100 | #45 | Exceptional 48.7% |
| Immigrants | Iran | 99.2 /100 | #46 | Exceptional 48.7% |
| Northern Europeans | 99.2 /100 | #47 | Exceptional 48.7% |
| Austrians | 99.2 /100 | #48 | Exceptional 48.7% |
| Bhutanese | 99.1 /100 | #49 | Exceptional 48.6% |
| Iranians | 99.0 /100 | #50 | Exceptional 48.6% |
| Whites/Caucasians | 99.0 /100 | #51 | Exceptional 48.6% |
| Russians | 98.9 /100 | #52 | Exceptional 48.6% |
| Immigrants | Austria | 98.8 /100 | #53 | Exceptional 48.5% |
| Immigrants | Moldova | 98.7 /100 | #54 | Exceptional 48.5% |
Demographics Similar to Chinese by Currently Married
In terms of currently married, the demographic groups most similar to Chinese are Scandinavian (49.5%, a difference of 0.020%), Pennsylvania German (49.6%, a difference of 0.14%), German (49.6%, a difference of 0.17%), Dutch (49.6%, a difference of 0.18%), and Immigrants from Scotland (49.3%, a difference of 0.31%).
| Demographics | Rating | Rank | Currently Married |
| Czechs | 99.9 /100 | #9 | Exceptional 49.9% |
| Filipinos | 99.9 /100 | #10 | Exceptional 49.7% |
| English | 99.9 /100 | #11 | Exceptional 49.7% |
| Swiss | 99.9 /100 | #12 | Exceptional 49.7% |
| Dutch | 99.9 /100 | #13 | Exceptional 49.6% |
| Germans | 99.9 /100 | #14 | Exceptional 49.6% |
| Pennsylvania Germans | 99.9 /100 | #15 | Exceptional 49.6% |
| Chinese | 99.9 /100 | #16 | Exceptional 49.5% |
| Scandinavians | 99.9 /100 | #17 | Exceptional 49.5% |
| Immigrants | Scotland | 99.8 /100 | #18 | Exceptional 49.3% |
| Europeans | 99.8 /100 | #19 | Exceptional 49.3% |
| Luxembourgers | 99.8 /100 | #20 | Exceptional 49.3% |
| Scottish | 99.8 /100 | #21 | Exceptional 49.2% |
| Bulgarians | 99.7 /100 | #22 | Exceptional 49.1% |
| Immigrants | Pakistan | 99.7 /100 | #23 | Exceptional 49.1% |