Nigerian vs Immigrants from Bulgaria Currently Married
COMPARE
Nigerian
Immigrants from Bulgaria
Currently Married
Currently Married Comparison
Nigerians
Immigrants from Bulgaria
43.4%
CURRENTLY MARRIED
0.1/ 100
METRIC RATING
274th/ 347
METRIC RANK
47.9%
CURRENTLY MARRIED
94.8/ 100
METRIC RATING
95th/ 347
METRIC RANK
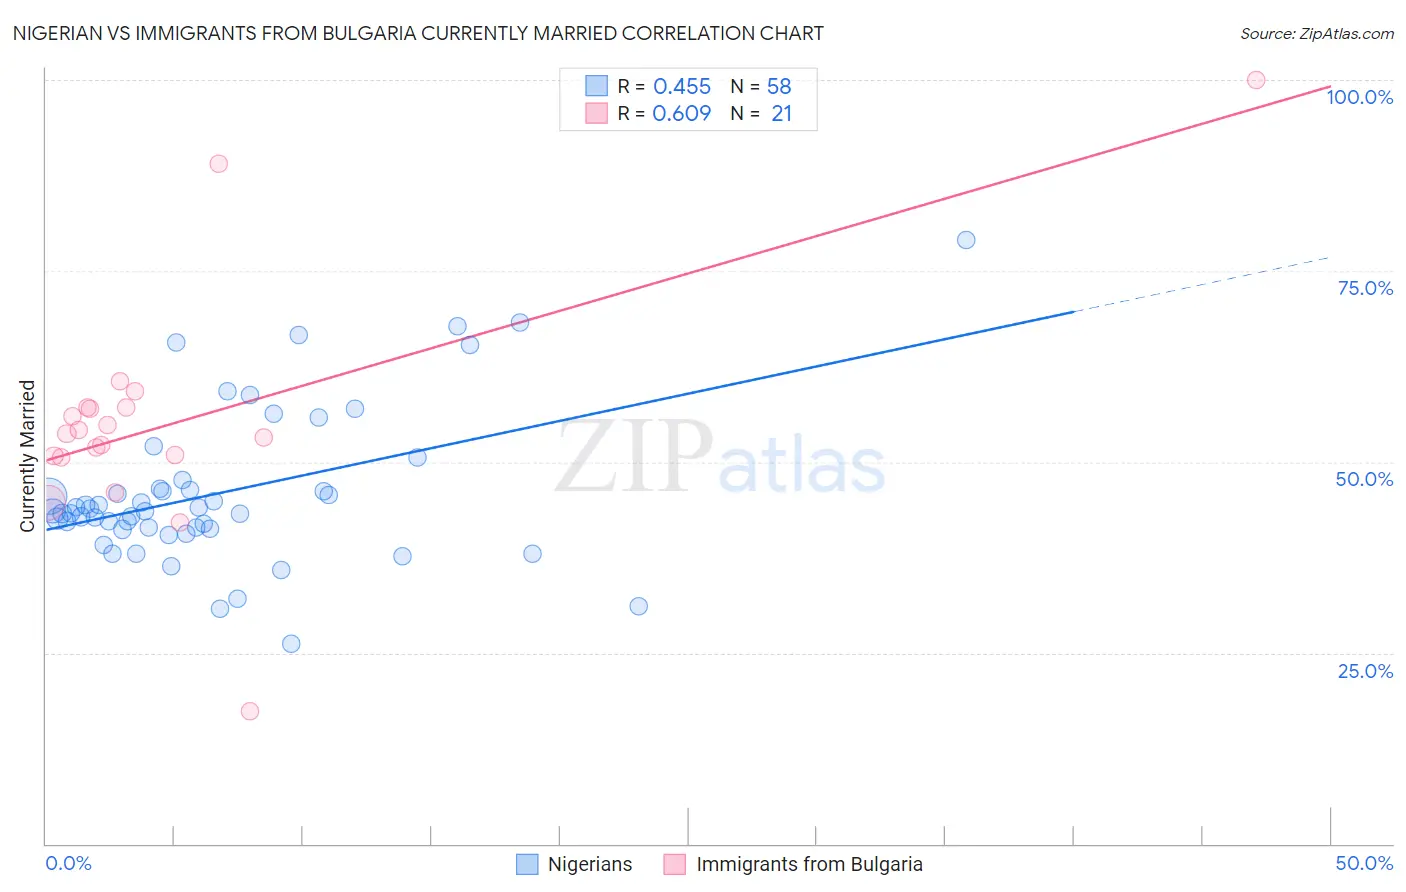
Nigerian vs Immigrants from Bulgaria Currently Married Correlation Chart
The statistical analysis conducted on geographies consisting of 332,730,636 people shows a moderate positive correlation between the proportion of Nigerians and percentage of population currently married in the United States with a correlation coefficient (R) of 0.455 and weighted average of 43.4%. Similarly, the statistical analysis conducted on geographies consisting of 172,548,361 people shows a significant positive correlation between the proportion of Immigrants from Bulgaria and percentage of population currently married in the United States with a correlation coefficient (R) of 0.609 and weighted average of 47.9%, a difference of 10.2%.
Currently Married Correlation Summary
| Measurement | Nigerian | Immigrants from Bulgaria |
| Minimum | 26.3% | 17.4% |
| Maximum | 79.1% | 100.0% |
| Range | 52.8% | 82.6% |
| Mean | 46.0% | 55.2% |
| Median | 43.6% | 53.7% |
| Interquartile 25% (IQ1) | 41.3% | 50.7% |
| Interquartile 75% (IQ3) | 46.5% | 57.1% |
| Interquartile Range (IQR) | 5.2% | 6.4% |
| Standard Deviation (Sample) | 10.1% | 16.0% |
| Standard Deviation (Population) | 10.0% | 15.6% |
Similar Demographics by Currently Married
Demographics Similar to Nigerians by Currently Married
In terms of currently married, the demographic groups most similar to Nigerians are Yaqui (43.4%, a difference of 0.020%), Colville (43.4%, a difference of 0.020%), Sierra Leonean (43.4%, a difference of 0.050%), Indonesian (43.5%, a difference of 0.060%), and Immigrants from Nigeria (43.4%, a difference of 0.060%).
| Demographics | Rating | Rank | Currently Married |
| Immigrants | Eritrea | 0.1 /100 | #267 | Tragic 43.6% |
| Spanish American Indians | 0.1 /100 | #268 | Tragic 43.6% |
| Immigrants | Sudan | 0.1 /100 | #269 | Tragic 43.5% |
| Salvadorans | 0.1 /100 | #270 | Tragic 43.5% |
| Bermudans | 0.1 /100 | #271 | Tragic 43.5% |
| Indonesians | 0.1 /100 | #272 | Tragic 43.5% |
| Yaqui | 0.1 /100 | #273 | Tragic 43.4% |
| Nigerians | 0.1 /100 | #274 | Tragic 43.4% |
| Colville | 0.1 /100 | #275 | Tragic 43.4% |
| Sierra Leoneans | 0.1 /100 | #276 | Tragic 43.4% |
| Immigrants | Nigeria | 0.1 /100 | #277 | Tragic 43.4% |
| Central Americans | 0.0 /100 | #278 | Tragic 43.3% |
| Central American Indians | 0.0 /100 | #279 | Tragic 43.3% |
| Apache | 0.0 /100 | #280 | Tragic 43.2% |
| Chippewa | 0.0 /100 | #281 | Tragic 43.2% |
Demographics Similar to Immigrants from Bulgaria by Currently Married
In terms of currently married, the demographic groups most similar to Immigrants from Bulgaria are Egyptian (47.9%, a difference of 0.0%), Immigrants from Ukraine (47.9%, a difference of 0.010%), Immigrants from China (47.9%, a difference of 0.020%), Native Hawaiian (47.9%, a difference of 0.040%), and Lebanese (47.9%, a difference of 0.050%).
| Demographics | Rating | Rank | Currently Married |
| Immigrants | Eastern Europe | 96.1 /100 | #88 | Exceptional 48.0% |
| Indians (Asian) | 95.8 /100 | #89 | Exceptional 48.0% |
| Americans | 95.7 /100 | #90 | Exceptional 48.0% |
| Immigrants | Bolivia | 95.6 /100 | #91 | Exceptional 47.9% |
| Koreans | 95.4 /100 | #92 | Exceptional 47.9% |
| Lebanese | 95.1 /100 | #93 | Exceptional 47.9% |
| Native Hawaiians | 95.0 /100 | #94 | Exceptional 47.9% |
| Immigrants | Bulgaria | 94.8 /100 | #95 | Exceptional 47.9% |
| Egyptians | 94.8 /100 | #96 | Exceptional 47.9% |
| Immigrants | Ukraine | 94.8 /100 | #97 | Exceptional 47.9% |
| Immigrants | China | 94.7 /100 | #98 | Exceptional 47.9% |
| Immigrants | Sweden | 94.3 /100 | #99 | Exceptional 47.8% |
| Celtics | 94.2 /100 | #100 | Exceptional 47.8% |
| Immigrants | Germany | 94.1 /100 | #101 | Exceptional 47.8% |
| Turks | 93.9 /100 | #102 | Exceptional 47.8% |