Nicaraguan vs Yup'ik Single Father Households
COMPARE
Nicaraguan
Yup'ik
Single Father Households
Single Father Households Comparison
Nicaraguans
Yup'ik
2.6%
SINGLE FATHER HOUSEHOLDS
0.1/ 100
METRIC RATING
281st/ 347
METRIC RANK
5.4%
SINGLE FATHER HOUSEHOLDS
0.0/ 100
METRIC RATING
347th/ 347
METRIC RANK
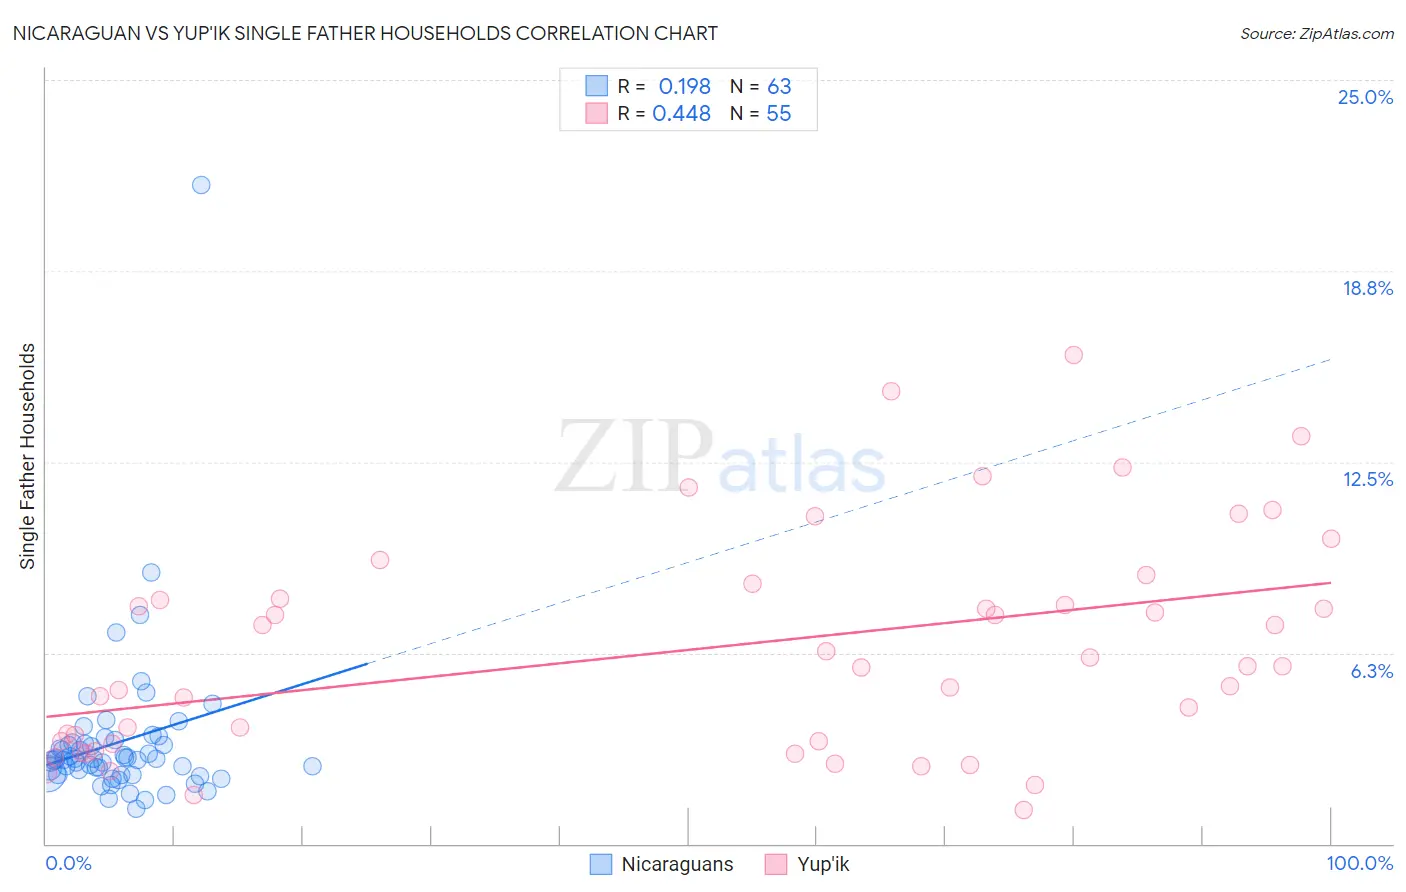
Nicaraguan vs Yup'ik Single Father Households Correlation Chart
The statistical analysis conducted on geographies consisting of 284,673,398 people shows a poor positive correlation between the proportion of Nicaraguans and percentage of single father households in the United States with a correlation coefficient (R) of 0.198 and weighted average of 2.6%. Similarly, the statistical analysis conducted on geographies consisting of 39,844,745 people shows a moderate positive correlation between the proportion of Yup'ik and percentage of single father households in the United States with a correlation coefficient (R) of 0.448 and weighted average of 5.4%, a difference of 104.0%.
Single Father Households Correlation Summary
| Measurement | Nicaraguan | Yup'ik |
| Minimum | 1.1% | 1.1% |
| Maximum | 21.5% | 16.0% |
| Range | 20.4% | 14.9% |
| Mean | 3.3% | 6.3% |
| Median | 2.8% | 5.8% |
| Interquartile 25% (IQ1) | 2.3% | 3.3% |
| Interquartile 75% (IQ3) | 3.3% | 8.0% |
| Interquartile Range (IQR) | 1.0% | 4.7% |
| Standard Deviation (Sample) | 2.7% | 3.6% |
| Standard Deviation (Population) | 2.7% | 3.5% |
Similar Demographics by Single Father Households
Demographics Similar to Nicaraguans by Single Father Households
In terms of single father households, the demographic groups most similar to Nicaraguans are Immigrants from Portugal (2.6%, a difference of 0.010%), Dutch West Indian (2.6%, a difference of 0.050%), Samoan (2.6%, a difference of 0.56%), Cherokee (2.6%, a difference of 0.60%), and Shoshone (2.6%, a difference of 0.65%).
| Demographics | Rating | Rank | Single Father Households |
| Puerto Ricans | 0.2 /100 | #274 | Tragic 2.6% |
| Immigrants | Dominican Republic | 0.2 /100 | #275 | Tragic 2.6% |
| Immigrants | Haiti | 0.1 /100 | #276 | Tragic 2.6% |
| Shoshone | 0.1 /100 | #277 | Tragic 2.6% |
| Cherokee | 0.1 /100 | #278 | Tragic 2.6% |
| Samoans | 0.1 /100 | #279 | Tragic 2.6% |
| Immigrants | Portugal | 0.1 /100 | #280 | Tragic 2.6% |
| Nicaraguans | 0.1 /100 | #281 | Tragic 2.6% |
| Dutch West Indians | 0.1 /100 | #282 | Tragic 2.6% |
| Immigrants | Nicaragua | 0.1 /100 | #283 | Tragic 2.7% |
| Hawaiians | 0.1 /100 | #284 | Tragic 2.7% |
| Ottawa | 0.1 /100 | #285 | Tragic 2.7% |
| Immigrants | Cuba | 0.1 /100 | #286 | Tragic 2.7% |
| Central American Indians | 0.0 /100 | #287 | Tragic 2.7% |
| Immigrants | Cambodia | 0.0 /100 | #288 | Tragic 2.7% |
Demographics Similar to Yup'ik by Single Father Households
In terms of single father households, the demographic groups most similar to Yup'ik are Inupiat (4.9%, a difference of 10.7%), Menominee (4.2%, a difference of 27.7%), Yakama (4.2%, a difference of 28.6%), Pima (4.2%, a difference of 28.9%), and Tohono O'odham (3.8%, a difference of 40.8%).
| Demographics | Rating | Rank | Single Father Households |
| Natives/Alaskans | 0.0 /100 | #333 | Tragic 3.2% |
| Yuman | 0.0 /100 | #334 | Tragic 3.3% |
| Colville | 0.0 /100 | #335 | Tragic 3.3% |
| Paiute | 0.0 /100 | #336 | Tragic 3.3% |
| Pueblo | 0.0 /100 | #337 | Tragic 3.3% |
| Sioux | 0.0 /100 | #338 | Tragic 3.3% |
| Alaskan Athabascans | 0.0 /100 | #339 | Tragic 3.4% |
| Alaska Natives | 0.0 /100 | #340 | Tragic 3.5% |
| Crow | 0.0 /100 | #341 | Tragic 3.5% |
| Tohono O'odham | 0.0 /100 | #342 | Tragic 3.8% |
| Pima | 0.0 /100 | #343 | Tragic 4.2% |
| Yakama | 0.0 /100 | #344 | Tragic 4.2% |
| Menominee | 0.0 /100 | #345 | Tragic 4.2% |
| Inupiat | 0.0 /100 | #346 | Tragic 4.9% |
| Yup'ik | 0.0 /100 | #347 | Tragic 5.4% |