Nicaraguan vs Native/Alaskan Single Mother Households
COMPARE
Nicaraguan
Native/Alaskan
Single Mother Households
Single Mother Households Comparison
Nicaraguans
Natives/Alaskans
7.2%
SINGLE MOTHER HOUSEHOLDS
0.5/ 100
METRIC RATING
246th/ 347
METRIC RANK
8.0%
SINGLE MOTHER HOUSEHOLDS
0.0/ 100
METRIC RATING
304th/ 347
METRIC RANK
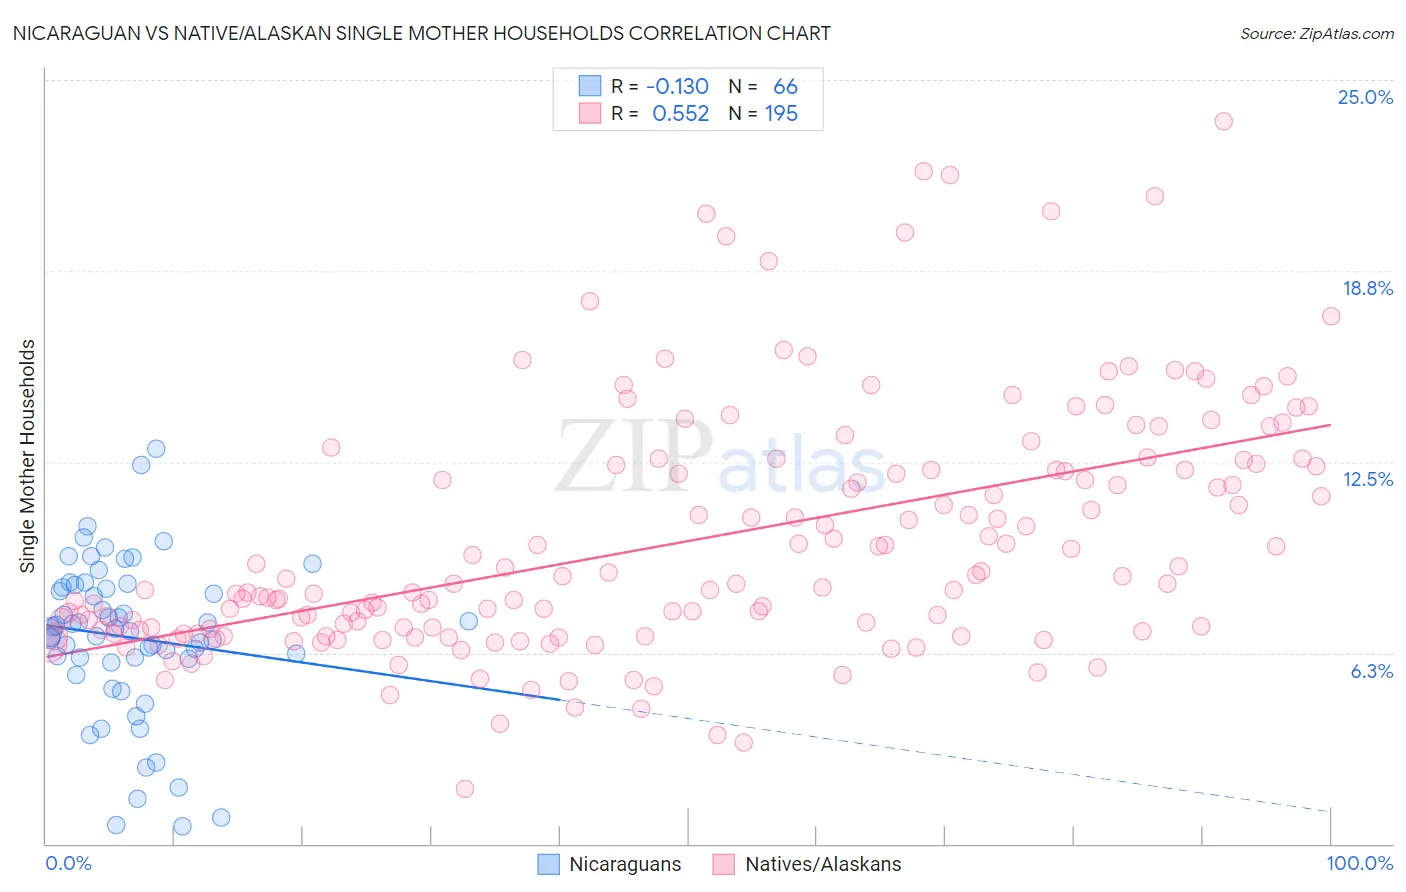
Nicaraguan vs Native/Alaskan Single Mother Households Correlation Chart
The statistical analysis conducted on geographies consisting of 285,416,265 people shows a poor negative correlation between the proportion of Nicaraguans and percentage of single mother households in the United States with a correlation coefficient (R) of -0.130 and weighted average of 7.2%. Similarly, the statistical analysis conducted on geographies consisting of 510,596,383 people shows a substantial positive correlation between the proportion of Natives/Alaskans and percentage of single mother households in the United States with a correlation coefficient (R) of 0.552 and weighted average of 8.0%, a difference of 10.8%.
Single Mother Households Correlation Summary
| Measurement | Nicaraguan | Native/Alaskan |
| Minimum | 0.56% | 1.8% |
| Maximum | 12.9% | 23.6% |
| Range | 12.4% | 21.8% |
| Mean | 6.8% | 9.9% |
| Median | 7.0% | 8.4% |
| Interquartile 25% (IQ1) | 6.0% | 7.0% |
| Interquartile 75% (IQ3) | 8.4% | 12.4% |
| Interquartile Range (IQR) | 2.3% | 5.4% |
| Standard Deviation (Sample) | 2.6% | 4.0% |
| Standard Deviation (Population) | 2.5% | 4.0% |
Similar Demographics by Single Mother Households
Demographics Similar to Nicaraguans by Single Mother Households
In terms of single mother households, the demographic groups most similar to Nicaraguans are Immigrants from Cambodia (7.2%, a difference of 0.18%), Dutch West Indian (7.3%, a difference of 0.25%), Spanish American Indian (7.3%, a difference of 0.28%), Cuban (7.2%, a difference of 0.53%), and Bermudan (7.3%, a difference of 0.57%).
| Demographics | Rating | Rank | Single Mother Households |
| Kiowa | 0.8 /100 | #239 | Tragic 7.1% |
| Immigrants | Panama | 0.7 /100 | #240 | Tragic 7.2% |
| Immigrants | Portugal | 0.6 /100 | #241 | Tragic 7.2% |
| Fijians | 0.6 /100 | #242 | Tragic 7.2% |
| Ecuadorians | 0.6 /100 | #243 | Tragic 7.2% |
| Cubans | 0.6 /100 | #244 | Tragic 7.2% |
| Immigrants | Cambodia | 0.5 /100 | #245 | Tragic 7.2% |
| Nicaraguans | 0.5 /100 | #246 | Tragic 7.2% |
| Dutch West Indians | 0.4 /100 | #247 | Tragic 7.3% |
| Spanish American Indians | 0.4 /100 | #248 | Tragic 7.3% |
| Bermudans | 0.4 /100 | #249 | Tragic 7.3% |
| Immigrants | Africa | 0.4 /100 | #250 | Tragic 7.3% |
| Malaysians | 0.3 /100 | #251 | Tragic 7.3% |
| Alaskan Athabascans | 0.3 /100 | #252 | Tragic 7.3% |
| Cajuns | 0.3 /100 | #253 | Tragic 7.3% |
Demographics Similar to Natives/Alaskans by Single Mother Households
In terms of single mother households, the demographic groups most similar to Natives/Alaskans are Colville (8.0%, a difference of 0.050%), Immigrants from Barbados (8.0%, a difference of 0.12%), Immigrants from St. Vincent and the Grenadines (8.0%, a difference of 0.36%), Immigrants from Central America (8.1%, a difference of 0.38%), and Immigrants from Bahamas (8.0%, a difference of 0.44%).
| Demographics | Rating | Rank | Single Mother Households |
| Hispanics or Latinos | 0.0 /100 | #297 | Tragic 7.9% |
| Immigrants | West Indies | 0.0 /100 | #298 | Tragic 7.9% |
| Houma | 0.0 /100 | #299 | Tragic 7.9% |
| Mexicans | 0.0 /100 | #300 | Tragic 8.0% |
| Chippewa | 0.0 /100 | #301 | Tragic 8.0% |
| Immigrants | Ghana | 0.0 /100 | #302 | Tragic 8.0% |
| Immigrants | Bahamas | 0.0 /100 | #303 | Tragic 8.0% |
| Natives/Alaskans | 0.0 /100 | #304 | Tragic 8.0% |
| Colville | 0.0 /100 | #305 | Tragic 8.0% |
| Immigrants | Barbados | 0.0 /100 | #306 | Tragic 8.0% |
| Immigrants | St. Vincent and the Grenadines | 0.0 /100 | #307 | Tragic 8.0% |
| Immigrants | Central America | 0.0 /100 | #308 | Tragic 8.1% |
| Cheyenne | 0.0 /100 | #309 | Tragic 8.1% |
| Hondurans | 0.0 /100 | #310 | Tragic 8.1% |
| Immigrants | Congo | 0.0 /100 | #311 | Tragic 8.1% |