New Zealander vs Scottish Single Father Households
COMPARE
New Zealander
Scottish
Single Father Households
Single Father Households Comparison
New Zealanders
Scottish
2.1%
SINGLE FATHER HOUSEHOLDS
99.7/ 100
METRIC RATING
82nd/ 347
METRIC RANK
2.3%
SINGLE FATHER HOUSEHOLDS
72.8/ 100
METRIC RATING
162nd/ 347
METRIC RANK
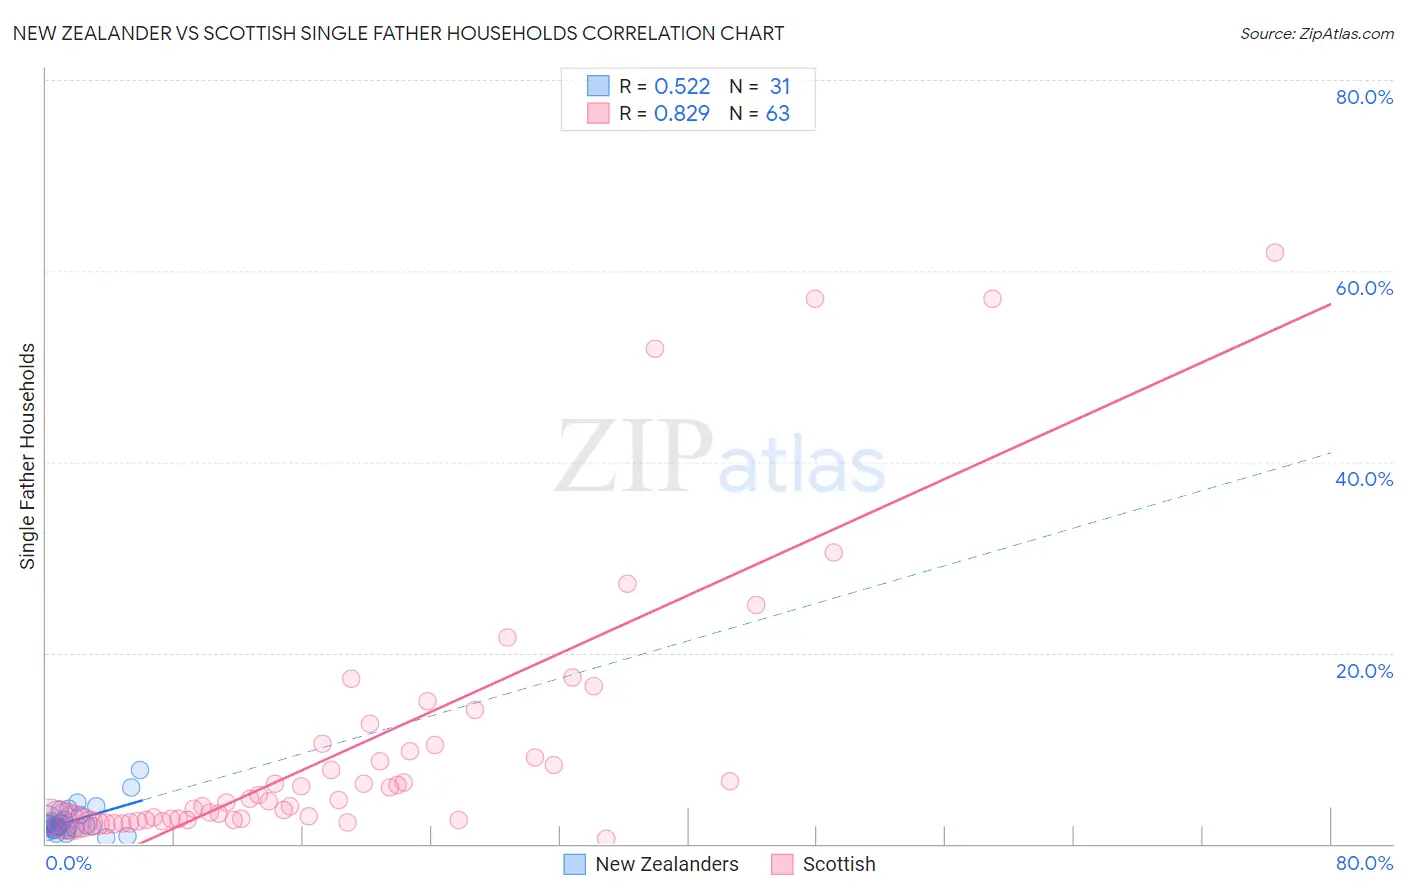
New Zealander vs Scottish Single Father Households Correlation Chart
The statistical analysis conducted on geographies consisting of 106,675,257 people shows a substantial positive correlation between the proportion of New Zealanders and percentage of single father households in the United States with a correlation coefficient (R) of 0.522 and weighted average of 2.1%. Similarly, the statistical analysis conducted on geographies consisting of 551,948,135 people shows a very strong positive correlation between the proportion of Scottish and percentage of single father households in the United States with a correlation coefficient (R) of 0.829 and weighted average of 2.3%, a difference of 9.8%.
Single Father Households Correlation Summary
| Measurement | New Zealander | Scottish |
| Minimum | 0.66% | 0.58% |
| Maximum | 7.8% | 61.9% |
| Range | 7.1% | 61.3% |
| Mean | 2.4% | 10.1% |
| Median | 2.0% | 4.4% |
| Interquartile 25% (IQ1) | 1.6% | 2.5% |
| Interquartile 75% (IQ3) | 2.5% | 10.3% |
| Interquartile Range (IQR) | 0.84% | 7.8% |
| Standard Deviation (Sample) | 1.5% | 14.0% |
| Standard Deviation (Population) | 1.5% | 13.8% |
Similar Demographics by Single Father Households
Demographics Similar to New Zealanders by Single Father Households
In terms of single father households, the demographic groups most similar to New Zealanders are Greek (2.1%, a difference of 0.010%), Armenian (2.1%, a difference of 0.050%), Immigrants from South Africa (2.1%, a difference of 0.13%), Immigrants from Asia (2.1%, a difference of 0.22%), and Carpatho Rusyn (2.1%, a difference of 0.31%).
| Demographics | Rating | Rank | Single Father Households |
| Immigrants | Sweden | 99.8 /100 | #75 | Exceptional 2.1% |
| Immigrants | Scotland | 99.8 /100 | #76 | Exceptional 2.1% |
| Immigrants | Saudi Arabia | 99.8 /100 | #77 | Exceptional 2.1% |
| Estonians | 99.7 /100 | #78 | Exceptional 2.1% |
| Immigrants | Asia | 99.7 /100 | #79 | Exceptional 2.1% |
| Immigrants | South Africa | 99.7 /100 | #80 | Exceptional 2.1% |
| Armenians | 99.7 /100 | #81 | Exceptional 2.1% |
| New Zealanders | 99.7 /100 | #82 | Exceptional 2.1% |
| Greeks | 99.7 /100 | #83 | Exceptional 2.1% |
| Carpatho Rusyns | 99.6 /100 | #84 | Exceptional 2.1% |
| Immigrants | Hungary | 99.6 /100 | #85 | Exceptional 2.1% |
| Asians | 99.6 /100 | #86 | Exceptional 2.1% |
| Lithuanians | 99.5 /100 | #87 | Exceptional 2.1% |
| Bhutanese | 99.5 /100 | #88 | Exceptional 2.1% |
| Immigrants | Armenia | 99.5 /100 | #89 | Exceptional 2.1% |
Demographics Similar to Scottish by Single Father Households
In terms of single father households, the demographic groups most similar to Scottish are Swiss (2.3%, a difference of 0.030%), Irish (2.3%, a difference of 0.070%), Pakistani (2.3%, a difference of 0.21%), Scotch-Irish (2.3%, a difference of 0.31%), and Immigrants from Bolivia (2.3%, a difference of 0.34%).
| Demographics | Rating | Rank | Single Father Households |
| Europeans | 80.9 /100 | #155 | Excellent 2.3% |
| Immigrants | South America | 79.9 /100 | #156 | Good 2.3% |
| Canadians | 79.7 /100 | #157 | Good 2.3% |
| Immigrants | Senegal | 79.4 /100 | #158 | Good 2.3% |
| Immigrants | West Indies | 77.9 /100 | #159 | Good 2.3% |
| Immigrants | Bolivia | 76.3 /100 | #160 | Good 2.3% |
| Swiss | 73.2 /100 | #161 | Good 2.3% |
| Scottish | 72.8 /100 | #162 | Good 2.3% |
| Irish | 72.1 /100 | #163 | Good 2.3% |
| Pakistanis | 70.6 /100 | #164 | Good 2.3% |
| Scotch-Irish | 69.4 /100 | #165 | Good 2.3% |
| English | 68.6 /100 | #166 | Good 2.3% |
| South Americans | 64.3 /100 | #167 | Good 2.3% |
| Icelanders | 63.1 /100 | #168 | Good 2.3% |
| Czechs | 62.5 /100 | #169 | Good 2.3% |