New Zealander vs Navajo Currently Married
COMPARE
New Zealander
Navajo
Currently Married
Currently Married Comparison
New Zealanders
Navajo
47.4%
CURRENTLY MARRIED
84.9/ 100
METRIC RATING
127th/ 347
METRIC RANK
39.0%
CURRENTLY MARRIED
0.0/ 100
METRIC RATING
341st/ 347
METRIC RANK
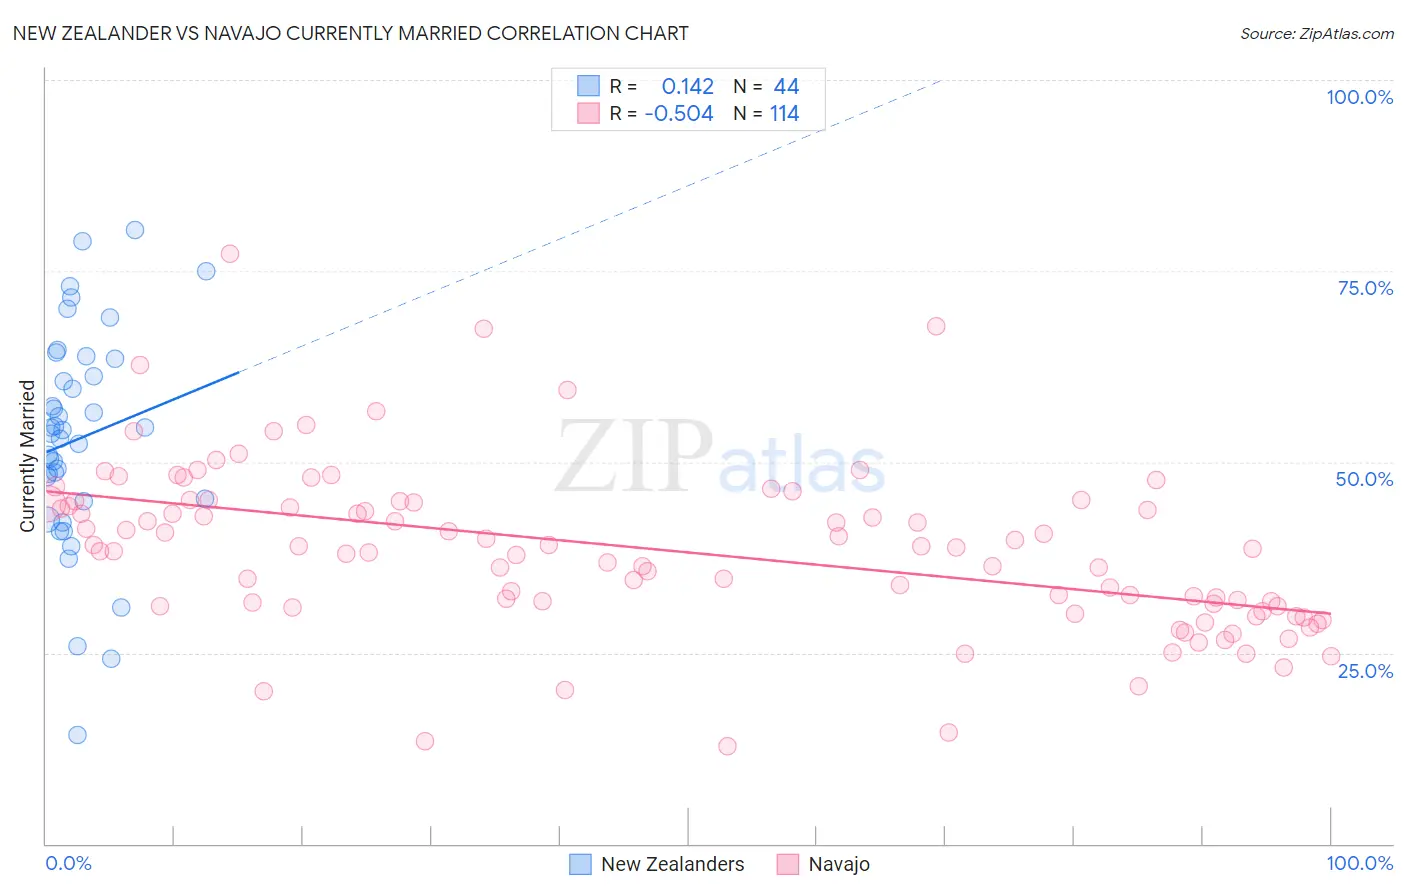
New Zealander vs Navajo Currently Married Correlation Chart
The statistical analysis conducted on geographies consisting of 106,918,657 people shows a poor positive correlation between the proportion of New Zealanders and percentage of population currently married in the United States with a correlation coefficient (R) of 0.142 and weighted average of 47.4%. Similarly, the statistical analysis conducted on geographies consisting of 224,862,150 people shows a substantial negative correlation between the proportion of Navajo and percentage of population currently married in the United States with a correlation coefficient (R) of -0.504 and weighted average of 39.0%, a difference of 21.4%.
Currently Married Correlation Summary
| Measurement | New Zealander | Navajo |
| Minimum | 14.3% | 12.8% |
| Maximum | 80.4% | 77.3% |
| Range | 66.1% | 64.5% |
| Mean | 53.0% | 38.4% |
| Median | 53.9% | 38.7% |
| Interquartile 25% (IQ1) | 45.0% | 31.1% |
| Interquartile 75% (IQ3) | 62.4% | 44.6% |
| Interquartile Range (IQR) | 17.4% | 13.5% |
| Standard Deviation (Sample) | 14.2% | 10.9% |
| Standard Deviation (Population) | 14.0% | 10.8% |
Similar Demographics by Currently Married
Demographics Similar to New Zealanders by Currently Married
In terms of currently married, the demographic groups most similar to New Zealanders are Immigrants from Jordan (47.4%, a difference of 0.0%), Okinawan (47.4%, a difference of 0.030%), Portuguese (47.3%, a difference of 0.040%), Sri Lankan (47.3%, a difference of 0.11%), and Laotian (47.4%, a difference of 0.13%).
| Demographics | Rating | Rank | Currently Married |
| Syrians | 88.9 /100 | #120 | Excellent 47.5% |
| Immigrants | Croatia | 88.6 /100 | #121 | Excellent 47.5% |
| Osage | 87.9 /100 | #122 | Excellent 47.5% |
| Immigrants | Kazakhstan | 87.2 /100 | #123 | Excellent 47.4% |
| Laotians | 86.6 /100 | #124 | Excellent 47.4% |
| Okinawans | 85.3 /100 | #125 | Excellent 47.4% |
| Immigrants | Jordan | 84.9 /100 | #126 | Excellent 47.4% |
| New Zealanders | 84.9 /100 | #127 | Excellent 47.4% |
| Portuguese | 84.2 /100 | #128 | Excellent 47.3% |
| Sri Lankans | 83.2 /100 | #129 | Excellent 47.3% |
| Immigrants | Iraq | 82.8 /100 | #130 | Excellent 47.3% |
| Icelanders | 82.4 /100 | #131 | Excellent 47.3% |
| Afghans | 81.8 /100 | #132 | Excellent 47.3% |
| Immigrants | Malaysia | 81.1 /100 | #133 | Excellent 47.3% |
| Immigrants | Australia | 81.1 /100 | #134 | Excellent 47.3% |
Demographics Similar to Navajo by Currently Married
In terms of currently married, the demographic groups most similar to Navajo are Immigrants from Dominican Republic (38.9%, a difference of 0.17%), Immigrants from Grenada (39.1%, a difference of 0.35%), Dominican (39.5%, a difference of 1.3%), Cape Verdean (39.6%, a difference of 1.5%), and Black/African American (39.6%, a difference of 1.6%).
| Demographics | Rating | Rank | Currently Married |
| Yup'ik | 0.0 /100 | #333 | Tragic 39.9% |
| Puerto Ricans | 0.0 /100 | #334 | Tragic 39.9% |
| Lumbee | 0.0 /100 | #335 | Tragic 39.8% |
| British West Indians | 0.0 /100 | #336 | Tragic 39.8% |
| Blacks/African Americans | 0.0 /100 | #337 | Tragic 39.6% |
| Cape Verdeans | 0.0 /100 | #338 | Tragic 39.6% |
| Dominicans | 0.0 /100 | #339 | Tragic 39.5% |
| Immigrants | Grenada | 0.0 /100 | #340 | Tragic 39.1% |
| Navajo | 0.0 /100 | #341 | Tragic 39.0% |
| Immigrants | Dominican Republic | 0.0 /100 | #342 | Tragic 38.9% |
| Pueblo | 0.0 /100 | #343 | Tragic 38.2% |
| Immigrants | Cabo Verde | 0.0 /100 | #344 | Tragic 37.8% |
| Tohono O'odham | 0.0 /100 | #345 | Tragic 36.8% |
| Hopi | 0.0 /100 | #346 | Tragic 36.5% |
| Pima | 0.0 /100 | #347 | Tragic 35.9% |