New Zealander vs Immigrants from Croatia Divorced or Separated
COMPARE
New Zealander
Immigrants from Croatia
Divorced or Separated
Divorced or Separated Comparison
New Zealanders
Immigrants from Croatia
11.9%
DIVORCED OR SEPARATED
87.5/ 100
METRIC RATING
133rd/ 347
METRIC RANK
11.6%
DIVORCED OR SEPARATED
98.3/ 100
METRIC RATING
102nd/ 347
METRIC RANK
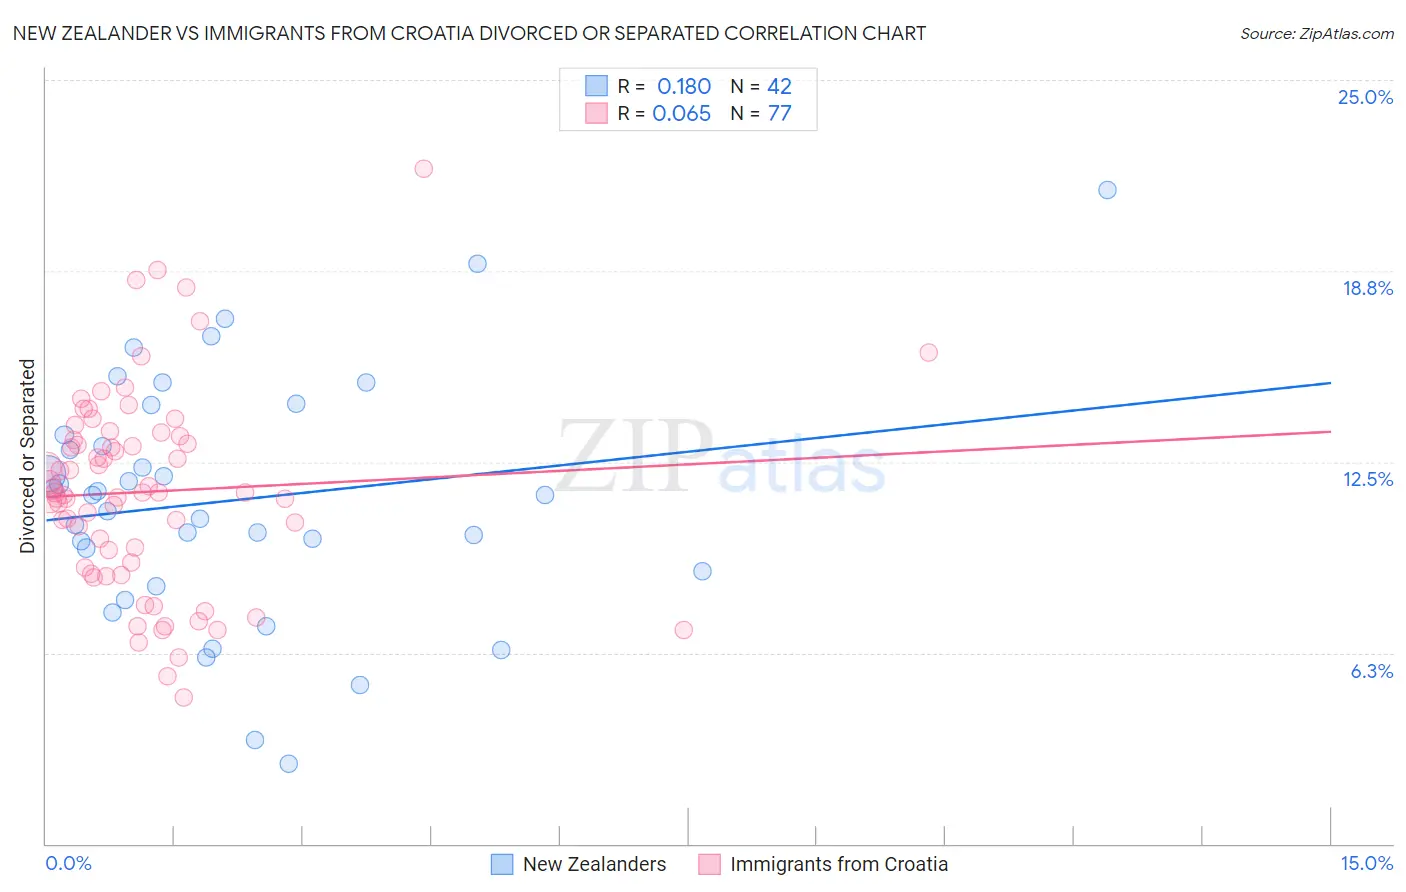
New Zealander vs Immigrants from Croatia Divorced or Separated Correlation Chart
The statistical analysis conducted on geographies consisting of 106,899,589 people shows a poor positive correlation between the proportion of New Zealanders and percentage of population currently divorced or separated in the United States with a correlation coefficient (R) of 0.180 and weighted average of 11.9%. Similarly, the statistical analysis conducted on geographies consisting of 132,566,764 people shows a slight positive correlation between the proportion of Immigrants from Croatia and percentage of population currently divorced or separated in the United States with a correlation coefficient (R) of 0.065 and weighted average of 11.6%, a difference of 1.9%.
Divorced or Separated Correlation Summary
| Measurement | New Zealander | Immigrants from Croatia |
| Minimum | 2.6% | 4.8% |
| Maximum | 21.4% | 22.1% |
| Range | 18.8% | 17.3% |
| Mean | 11.2% | 11.5% |
| Median | 11.4% | 11.5% |
| Interquartile 25% (IQ1) | 8.9% | 9.1% |
| Interquartile 75% (IQ3) | 13.4% | 13.3% |
| Interquartile Range (IQR) | 4.5% | 4.1% |
| Standard Deviation (Sample) | 4.0% | 3.3% |
| Standard Deviation (Population) | 3.9% | 3.2% |
Similar Demographics by Divorced or Separated
Demographics Similar to New Zealanders by Divorced or Separated
In terms of divorced or separated, the demographic groups most similar to New Zealanders are Immigrants from Afghanistan (11.8%, a difference of 0.030%), Immigrants from Austria (11.8%, a difference of 0.060%), Immigrants from Cambodia (11.8%, a difference of 0.060%), Immigrants from St. Vincent and the Grenadines (11.8%, a difference of 0.070%), and Immigrants from Ecuador (11.8%, a difference of 0.11%).
| Demographics | Rating | Rank | Divorced or Separated |
| South American Indians | 92.1 /100 | #126 | Exceptional 11.8% |
| South Africans | 88.9 /100 | #127 | Excellent 11.8% |
| Immigrants | Ecuador | 88.9 /100 | #128 | Excellent 11.8% |
| Immigrants | St. Vincent and the Grenadines | 88.4 /100 | #129 | Excellent 11.8% |
| Immigrants | Austria | 88.2 /100 | #130 | Excellent 11.8% |
| Immigrants | Cambodia | 88.2 /100 | #131 | Excellent 11.8% |
| Immigrants | Afghanistan | 87.9 /100 | #132 | Excellent 11.8% |
| New Zealanders | 87.5 /100 | #133 | Excellent 11.9% |
| Argentineans | 85.1 /100 | #134 | Excellent 11.9% |
| Danes | 84.8 /100 | #135 | Excellent 11.9% |
| Carpatho Rusyns | 84.8 /100 | #136 | Excellent 11.9% |
| Alsatians | 84.0 /100 | #137 | Excellent 11.9% |
| Immigrants | Netherlands | 83.9 /100 | #138 | Excellent 11.9% |
| Australians | 83.6 /100 | #139 | Excellent 11.9% |
| Lebanese | 83.4 /100 | #140 | Excellent 11.9% |
Demographics Similar to Immigrants from Croatia by Divorced or Separated
In terms of divorced or separated, the demographic groups most similar to Immigrants from Croatia are Maltese (11.6%, a difference of 0.040%), Salvadoran (11.6%, a difference of 0.050%), Immigrants from Guyana (11.6%, a difference of 0.14%), Immigrants from Northern Europe (11.6%, a difference of 0.17%), and Immigrants from El Salvador (11.7%, a difference of 0.18%).
| Demographics | Rating | Rank | Divorced or Separated |
| Immigrants | Serbia | 98.8 /100 | #95 | Exceptional 11.6% |
| Immigrants | Ukraine | 98.7 /100 | #96 | Exceptional 11.6% |
| Latvians | 98.7 /100 | #97 | Exceptional 11.6% |
| Immigrants | Jordan | 98.6 /100 | #98 | Exceptional 11.6% |
| Immigrants | Sweden | 98.6 /100 | #99 | Exceptional 11.6% |
| Immigrants | Northern Europe | 98.6 /100 | #100 | Exceptional 11.6% |
| Immigrants | Guyana | 98.5 /100 | #101 | Exceptional 11.6% |
| Immigrants | Croatia | 98.3 /100 | #102 | Exceptional 11.6% |
| Maltese | 98.2 /100 | #103 | Exceptional 11.6% |
| Salvadorans | 98.2 /100 | #104 | Exceptional 11.6% |
| Immigrants | El Salvador | 97.9 /100 | #105 | Exceptional 11.7% |
| Immigrants | Kazakhstan | 97.8 /100 | #106 | Exceptional 11.7% |
| Native Hawaiians | 97.2 /100 | #107 | Exceptional 11.7% |
| Greeks | 96.9 /100 | #108 | Exceptional 11.7% |
| Immigrants | South Africa | 96.9 /100 | #109 | Exceptional 11.7% |