Nepalese vs Uruguayan Single Father Households
COMPARE
Nepalese
Uruguayan
Single Father Households
Single Father Households Comparison
Nepalese
Uruguayans
3.1%
SINGLE FATHER HOUSEHOLDS
0.0/ 100
METRIC RATING
330th/ 347
METRIC RANK
2.4%
SINGLE FATHER HOUSEHOLDS
29.7/ 100
METRIC RATING
193rd/ 347
METRIC RANK
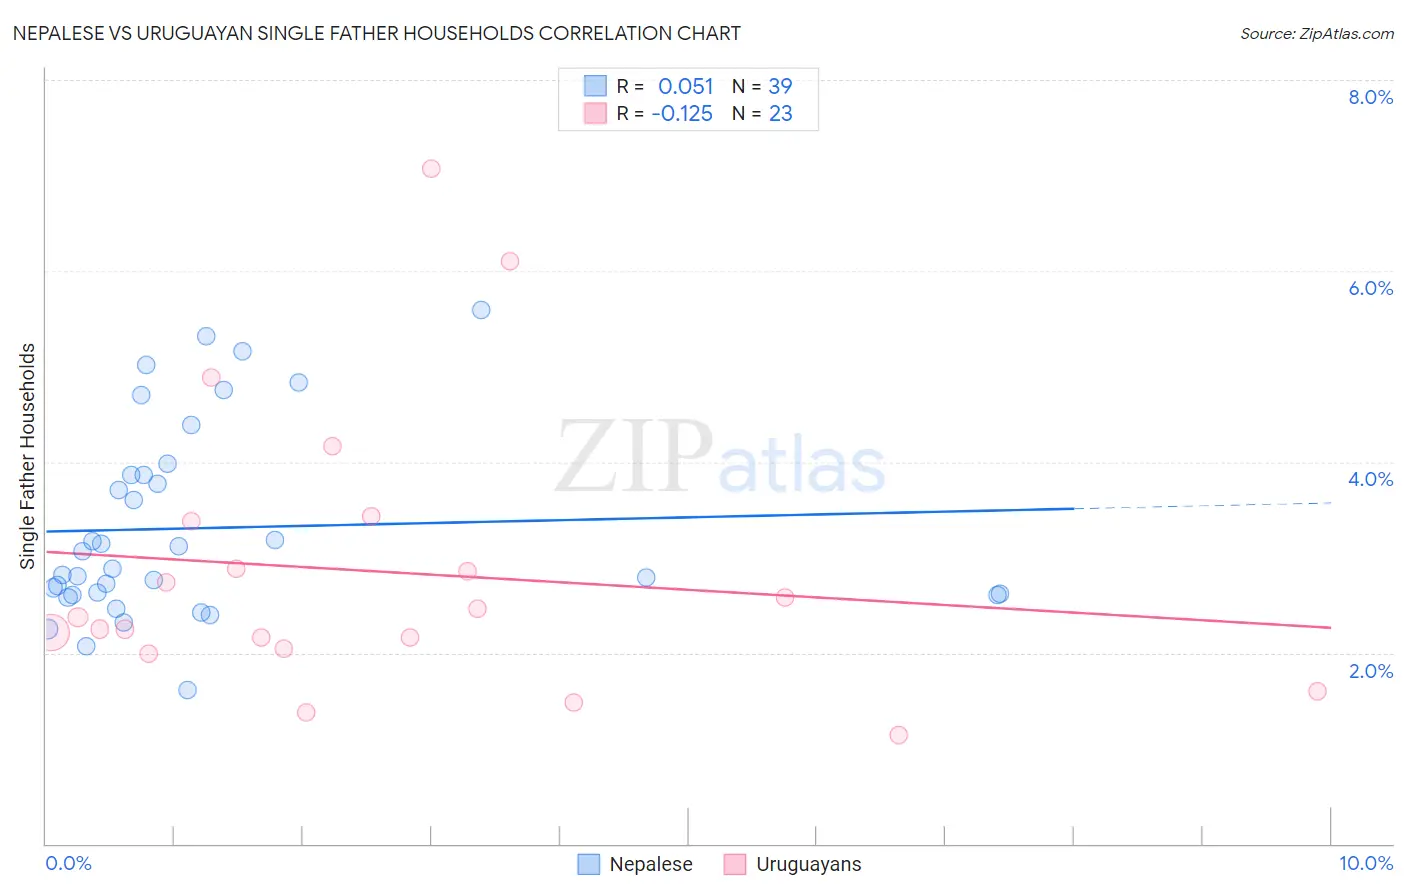
Nepalese vs Uruguayan Single Father Households Correlation Chart
The statistical analysis conducted on geographies consisting of 24,491,034 people shows a slight positive correlation between the proportion of Nepalese and percentage of single father households in the United States with a correlation coefficient (R) of 0.051 and weighted average of 3.1%. Similarly, the statistical analysis conducted on geographies consisting of 144,465,475 people shows a poor negative correlation between the proportion of Uruguayans and percentage of single father households in the United States with a correlation coefficient (R) of -0.125 and weighted average of 2.4%, a difference of 31.3%.
Single Father Households Correlation Summary
| Measurement | Nepalese | Uruguayan |
| Minimum | 1.6% | 1.1% |
| Maximum | 5.6% | 7.1% |
| Range | 4.0% | 5.9% |
| Mean | 3.3% | 2.9% |
| Median | 2.9% | 2.4% |
| Interquartile 25% (IQ1) | 2.6% | 2.0% |
| Interquartile 75% (IQ3) | 3.9% | 3.4% |
| Interquartile Range (IQR) | 1.3% | 1.3% |
| Standard Deviation (Sample) | 1.0% | 1.5% |
| Standard Deviation (Population) | 0.99% | 1.4% |
Similar Demographics by Single Father Households
Demographics Similar to Nepalese by Single Father Households
In terms of single father households, the demographic groups most similar to Nepalese are Chippewa (3.1%, a difference of 0.88%), Immigrants from Cabo Verde (3.1%, a difference of 0.98%), Bangladeshi (3.1%, a difference of 1.5%), Navajo (3.2%, a difference of 2.3%), and Yaqui (3.2%, a difference of 2.3%).
| Demographics | Rating | Rank | Single Father Households |
| Immigrants | Central America | 0.0 /100 | #323 | Tragic 3.0% |
| Fijians | 0.0 /100 | #324 | Tragic 3.0% |
| Immigrants | Mexico | 0.0 /100 | #325 | Tragic 3.0% |
| Aleuts | 0.0 /100 | #326 | Tragic 3.0% |
| Bangladeshis | 0.0 /100 | #327 | Tragic 3.1% |
| Immigrants | Cabo Verde | 0.0 /100 | #328 | Tragic 3.1% |
| Chippewa | 0.0 /100 | #329 | Tragic 3.1% |
| Nepalese | 0.0 /100 | #330 | Tragic 3.1% |
| Navajo | 0.0 /100 | #331 | Tragic 3.2% |
| Yaqui | 0.0 /100 | #332 | Tragic 3.2% |
| Natives/Alaskans | 0.0 /100 | #333 | Tragic 3.2% |
| Yuman | 0.0 /100 | #334 | Tragic 3.3% |
| Colville | 0.0 /100 | #335 | Tragic 3.3% |
| Paiute | 0.0 /100 | #336 | Tragic 3.3% |
| Pueblo | 0.0 /100 | #337 | Tragic 3.3% |
Demographics Similar to Uruguayans by Single Father Households
In terms of single father households, the demographic groups most similar to Uruguayans are Immigrants from Sudan (2.4%, a difference of 0.010%), Panamanian (2.4%, a difference of 0.010%), Immigrants from Africa (2.4%, a difference of 0.030%), Immigrants from Philippines (2.4%, a difference of 0.090%), and Kenyan (2.4%, a difference of 0.14%).
| Demographics | Rating | Rank | Single Father Households |
| Immigrants | Bosnia and Herzegovina | 40.4 /100 | #186 | Average 2.4% |
| Immigrants | Colombia | 34.0 /100 | #187 | Fair 2.4% |
| Hmong | 33.0 /100 | #188 | Fair 2.4% |
| U.S. Virgin Islanders | 31.8 /100 | #189 | Fair 2.4% |
| French | 31.7 /100 | #190 | Fair 2.4% |
| Immigrants | Africa | 30.0 /100 | #191 | Fair 2.4% |
| Immigrants | Sudan | 29.8 /100 | #192 | Fair 2.4% |
| Uruguayans | 29.7 /100 | #193 | Fair 2.4% |
| Panamanians | 29.6 /100 | #194 | Fair 2.4% |
| Immigrants | Philippines | 28.7 /100 | #195 | Fair 2.4% |
| Kenyans | 28.0 /100 | #196 | Fair 2.4% |
| Germans | 28.0 /100 | #197 | Fair 2.4% |
| Scandinavians | 27.4 /100 | #198 | Fair 2.4% |
| Immigrants | Vietnam | 27.1 /100 | #199 | Fair 2.4% |
| Peruvians | 27.1 /100 | #200 | Fair 2.4% |