Native Hawaiian vs U.S. Virgin Islander Family Households
COMPARE
Native Hawaiian
U.S. Virgin Islander
Family Households
Family Households Comparison
Native Hawaiians
U.S. Virgin Islanders
68.4%
FAMILY HOUSEHOLDS
100.0/ 100
METRIC RATING
9th/ 347
METRIC RANK
62.6%
FAMILY HOUSEHOLDS
0.0/ 100
METRIC RATING
291st/ 347
METRIC RANK
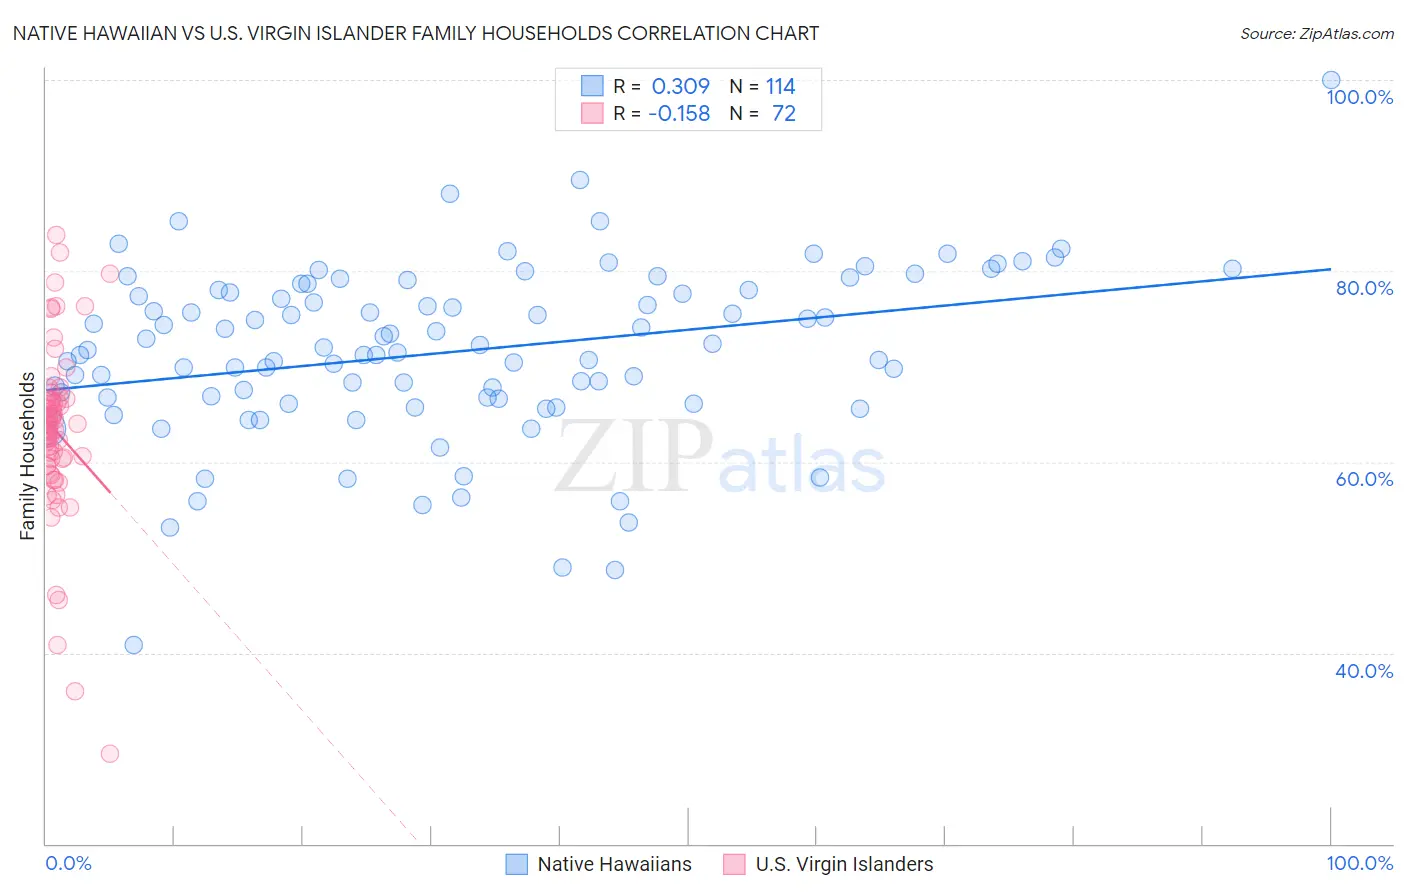
Native Hawaiian vs U.S. Virgin Islander Family Households Correlation Chart
The statistical analysis conducted on geographies consisting of 331,876,640 people shows a mild positive correlation between the proportion of Native Hawaiians and percentage of family households in the United States with a correlation coefficient (R) of 0.309 and weighted average of 68.4%. Similarly, the statistical analysis conducted on geographies consisting of 87,507,759 people shows a poor negative correlation between the proportion of U.S. Virgin Islanders and percentage of family households in the United States with a correlation coefficient (R) of -0.158 and weighted average of 62.6%, a difference of 9.2%.
Family Households Correlation Summary
| Measurement | Native Hawaiian | U.S. Virgin Islander |
| Minimum | 40.9% | 29.5% |
| Maximum | 100.0% | 83.8% |
| Range | 59.1% | 54.3% |
| Mean | 71.6% | 63.2% |
| Median | 71.9% | 63.9% |
| Interquartile 25% (IQ1) | 66.7% | 59.9% |
| Interquartile 75% (IQ3) | 78.0% | 66.5% |
| Interquartile Range (IQR) | 11.3% | 6.6% |
| Standard Deviation (Sample) | 9.1% | 9.1% |
| Standard Deviation (Population) | 9.0% | 9.1% |
Similar Demographics by Family Households
Demographics Similar to Native Hawaiians by Family Households
In terms of family households, the demographic groups most similar to Native Hawaiians are Immigrants from Philippines (68.3%, a difference of 0.070%), Immigrants from Central America (68.3%, a difference of 0.14%), Korean (68.3%, a difference of 0.17%), Pueblo (68.2%, a difference of 0.25%), and Immigrants from Cuba (68.2%, a difference of 0.26%).
| Demographics | Rating | Rank | Family Households |
| Spanish American Indians | 100.0 /100 | #2 | Exceptional 71.2% |
| Tongans | 100.0 /100 | #3 | Exceptional 69.6% |
| Yakama | 100.0 /100 | #4 | Exceptional 69.3% |
| Yuman | 100.0 /100 | #5 | Exceptional 69.3% |
| Immigrants | Mexico | 100.0 /100 | #6 | Exceptional 69.1% |
| Mexicans | 100.0 /100 | #7 | Exceptional 69.0% |
| Immigrants | Fiji | 100.0 /100 | #8 | Exceptional 68.8% |
| Native Hawaiians | 100.0 /100 | #9 | Exceptional 68.4% |
| Immigrants | Philippines | 100.0 /100 | #10 | Exceptional 68.3% |
| Immigrants | Central America | 100.0 /100 | #11 | Exceptional 68.3% |
| Koreans | 100.0 /100 | #12 | Exceptional 68.3% |
| Pueblo | 100.0 /100 | #13 | Exceptional 68.2% |
| Immigrants | Cuba | 100.0 /100 | #14 | Exceptional 68.2% |
| Assyrians/Chaldeans/Syriacs | 100.0 /100 | #15 | Exceptional 68.2% |
| Immigrants | Vietnam | 100.0 /100 | #16 | Exceptional 68.2% |
Demographics Similar to U.S. Virgin Islanders by Family Households
In terms of family households, the demographic groups most similar to U.S. Virgin Islanders are Immigrants from Grenada (62.6%, a difference of 0.050%), Immigrants from Burma/Myanmar (62.6%, a difference of 0.050%), Immigrants from Nepal (62.7%, a difference of 0.13%), Immigrants from Sweden (62.5%, a difference of 0.18%), and Immigrants from Uganda (62.7%, a difference of 0.22%).
| Demographics | Rating | Rank | Family Households |
| Australians | 0.1 /100 | #284 | Tragic 62.8% |
| Mongolians | 0.1 /100 | #285 | Tragic 62.8% |
| British West Indians | 0.1 /100 | #286 | Tragic 62.8% |
| Latvians | 0.1 /100 | #287 | Tragic 62.8% |
| Immigrants | Uganda | 0.1 /100 | #288 | Tragic 62.7% |
| Immigrants | Nepal | 0.1 /100 | #289 | Tragic 62.7% |
| Immigrants | Grenada | 0.0 /100 | #290 | Tragic 62.6% |
| U.S. Virgin Islanders | 0.0 /100 | #291 | Tragic 62.6% |
| Immigrants | Burma/Myanmar | 0.0 /100 | #292 | Tragic 62.6% |
| Immigrants | Sweden | 0.0 /100 | #293 | Tragic 62.5% |
| Barbadians | 0.0 /100 | #294 | Tragic 62.5% |
| Okinawans | 0.0 /100 | #295 | Tragic 62.5% |
| Slovenes | 0.0 /100 | #296 | Tragic 62.4% |
| French American Indians | 0.0 /100 | #297 | Tragic 62.4% |
| Immigrants | Spain | 0.0 /100 | #298 | Tragic 62.4% |