Native Hawaiian vs Romanian Single Mother Households
COMPARE
Native Hawaiian
Romanian
Single Mother Households
Single Mother Households Comparison
Native Hawaiians
Romanians
6.1%
SINGLE MOTHER HOUSEHOLDS
75.0/ 100
METRIC RATING
156th/ 347
METRIC RANK
5.6%
SINGLE MOTHER HOUSEHOLDS
98.1/ 100
METRIC RATING
77th/ 347
METRIC RANK
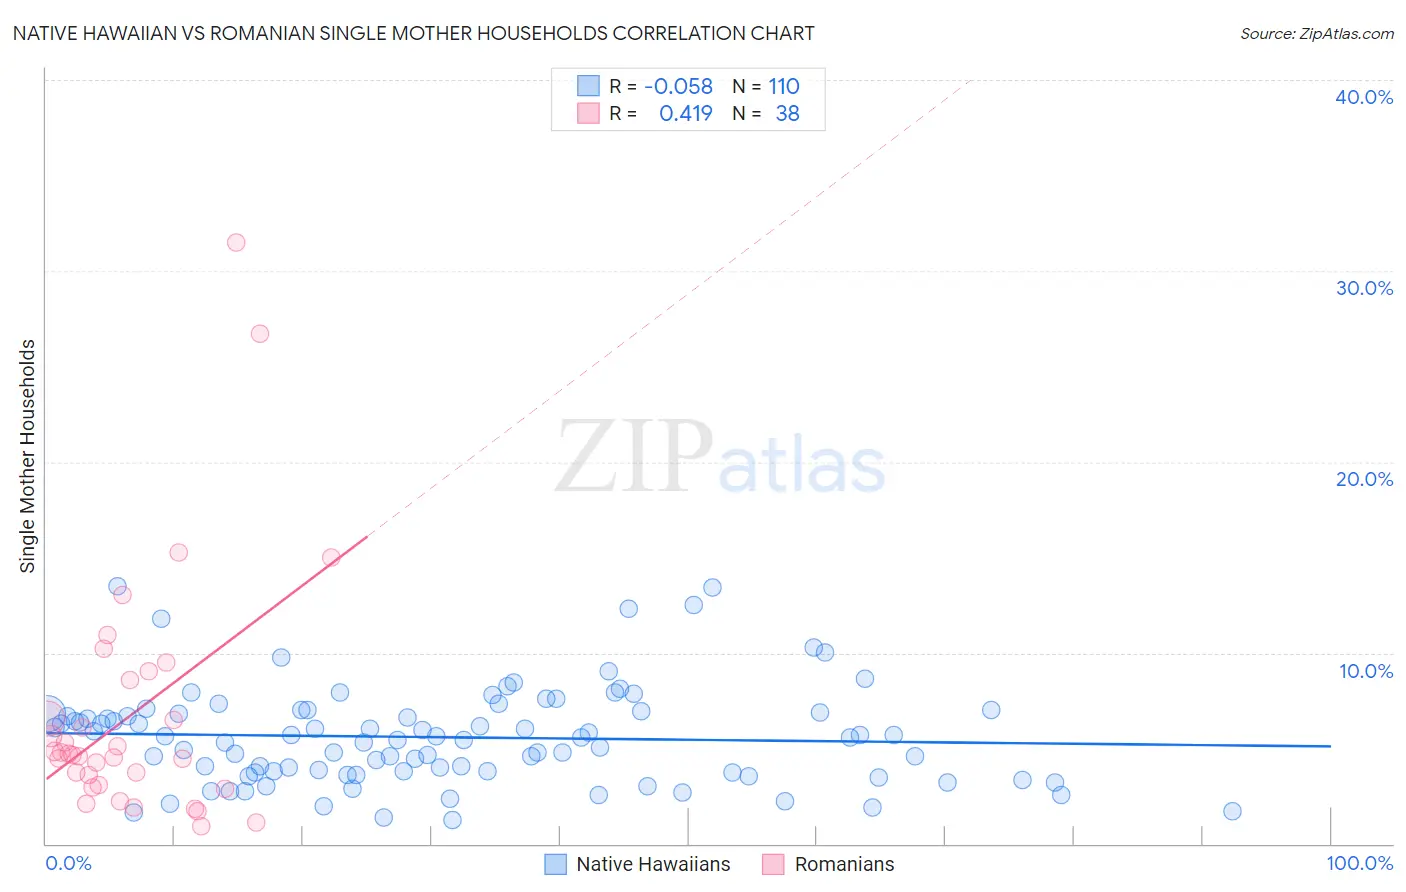
Native Hawaiian vs Romanian Single Mother Households Correlation Chart
The statistical analysis conducted on geographies consisting of 331,207,182 people shows a slight negative correlation between the proportion of Native Hawaiians and percentage of single mother households in the United States with a correlation coefficient (R) of -0.058 and weighted average of 6.1%. Similarly, the statistical analysis conducted on geographies consisting of 376,701,269 people shows a moderate positive correlation between the proportion of Romanians and percentage of single mother households in the United States with a correlation coefficient (R) of 0.419 and weighted average of 5.6%, a difference of 8.8%.
Single Mother Households Correlation Summary
| Measurement | Native Hawaiian | Romanian |
| Minimum | 1.3% | 0.92% |
| Maximum | 13.5% | 31.5% |
| Range | 12.2% | 30.6% |
| Mean | 5.6% | 6.8% |
| Median | 5.5% | 4.7% |
| Interquartile 25% (IQ1) | 3.7% | 3.0% |
| Interquartile 75% (IQ3) | 6.9% | 8.6% |
| Interquartile Range (IQR) | 3.1% | 5.6% |
| Standard Deviation (Sample) | 2.5% | 6.5% |
| Standard Deviation (Population) | 2.5% | 6.4% |
Similar Demographics by Single Mother Households
Demographics Similar to Native Hawaiians by Single Mother Households
In terms of single mother households, the demographic groups most similar to Native Hawaiians are Chilean (6.1%, a difference of 0.11%), White/Caucasian (6.1%, a difference of 0.23%), Celtic (6.1%, a difference of 0.24%), Yugoslavian (6.1%, a difference of 0.28%), and Iraqi (6.1%, a difference of 0.29%).
| Demographics | Rating | Rank | Single Mother Households |
| Immigrants | Albania | 81.5 /100 | #149 | Excellent 6.1% |
| Zimbabweans | 80.7 /100 | #150 | Excellent 6.1% |
| Immigrants | Southern Europe | 80.5 /100 | #151 | Excellent 6.1% |
| Pakistanis | 79.2 /100 | #152 | Good 6.1% |
| Immigrants | Brazil | 78.9 /100 | #153 | Good 6.1% |
| Immigrants | Philippines | 78.5 /100 | #154 | Good 6.1% |
| Whites/Caucasians | 76.5 /100 | #155 | Good 6.1% |
| Native Hawaiians | 75.0 /100 | #156 | Good 6.1% |
| Chileans | 74.2 /100 | #157 | Good 6.1% |
| Celtics | 73.3 /100 | #158 | Good 6.1% |
| Yugoslavians | 73.1 /100 | #159 | Good 6.1% |
| Iraqis | 73.0 /100 | #160 | Good 6.1% |
| Immigrants | Germany | 72.4 /100 | #161 | Good 6.1% |
| Immigrants | Zimbabwe | 69.9 /100 | #162 | Good 6.2% |
| Alsatians | 68.7 /100 | #163 | Good 6.2% |
Demographics Similar to Romanians by Single Mother Households
In terms of single mother households, the demographic groups most similar to Romanians are Swiss (5.6%, a difference of 0.0%), New Zealander (5.6%, a difference of 0.19%), Immigrants from Sri Lanka (5.6%, a difference of 0.21%), Slovene (5.6%, a difference of 0.25%), and Czech (5.6%, a difference of 0.31%).
| Demographics | Rating | Rank | Single Mother Households |
| Immigrants | Eastern Europe | 98.4 /100 | #70 | Exceptional 5.6% |
| Immigrants | Kazakhstan | 98.4 /100 | #71 | Exceptional 5.6% |
| Immigrants | Netherlands | 98.4 /100 | #72 | Exceptional 5.6% |
| Immigrants | Asia | 98.4 /100 | #73 | Exceptional 5.6% |
| Immigrants | North America | 98.3 /100 | #74 | Exceptional 5.6% |
| Slovenes | 98.3 /100 | #75 | Exceptional 5.6% |
| New Zealanders | 98.2 /100 | #76 | Exceptional 5.6% |
| Romanians | 98.1 /100 | #77 | Exceptional 5.6% |
| Swiss | 98.1 /100 | #78 | Exceptional 5.6% |
| Immigrants | Sri Lanka | 98.0 /100 | #79 | Exceptional 5.6% |
| Czechs | 97.9 /100 | #80 | Exceptional 5.6% |
| Immigrants | Moldova | 97.9 /100 | #81 | Exceptional 5.6% |
| Immigrants | Malaysia | 97.8 /100 | #82 | Exceptional 5.7% |
| Immigrants | Hungary | 97.8 /100 | #83 | Exceptional 5.7% |
| Carpatho Rusyns | 97.7 /100 | #84 | Exceptional 5.7% |