Moroccan vs Kenyan Currently Married
COMPARE
Moroccan
Kenyan
Currently Married
Currently Married Comparison
Moroccans
Kenyans
44.6%
CURRENTLY MARRIED
0.9/ 100
METRIC RATING
238th/ 347
METRIC RANK
45.2%
CURRENTLY MARRIED
3.1/ 100
METRIC RATING
220th/ 347
METRIC RANK
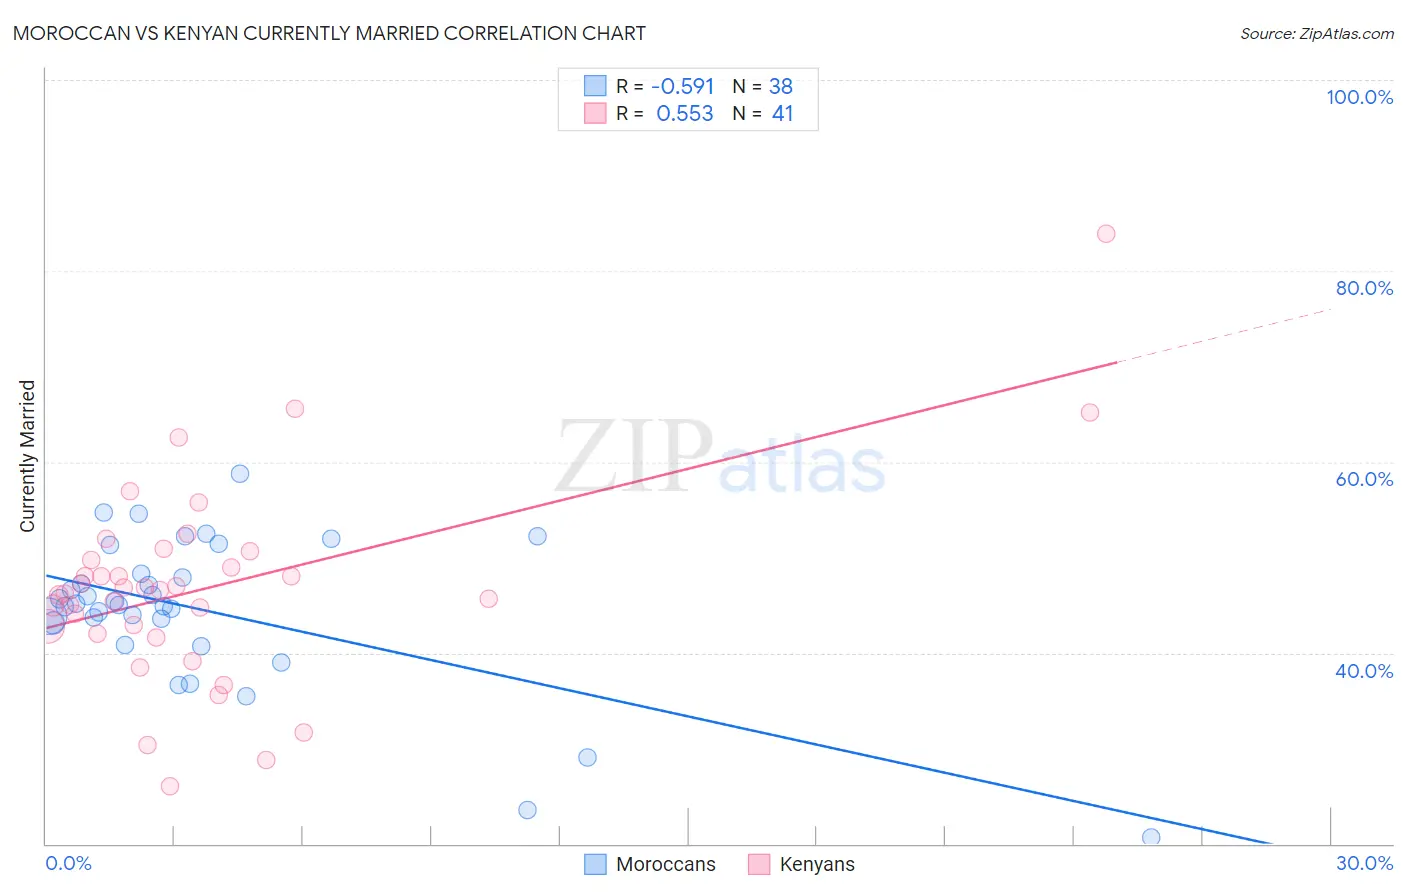
Moroccan vs Kenyan Currently Married Correlation Chart
The statistical analysis conducted on geographies consisting of 201,812,139 people shows a substantial negative correlation between the proportion of Moroccans and percentage of population currently married in the United States with a correlation coefficient (R) of -0.591 and weighted average of 44.6%. Similarly, the statistical analysis conducted on geographies consisting of 168,238,911 people shows a substantial positive correlation between the proportion of Kenyans and percentage of population currently married in the United States with a correlation coefficient (R) of 0.553 and weighted average of 45.2%, a difference of 1.2%.
Currently Married Correlation Summary
| Measurement | Moroccan | Kenyan |
| Minimum | 20.7% | 26.0% |
| Maximum | 58.8% | 83.9% |
| Range | 38.1% | 57.9% |
| Mean | 44.4% | 46.8% |
| Median | 45.0% | 46.5% |
| Interquartile 25% (IQ1) | 43.1% | 42.3% |
| Interquartile 75% (IQ3) | 48.3% | 50.1% |
| Interquartile Range (IQR) | 5.2% | 7.8% |
| Standard Deviation (Sample) | 7.9% | 10.4% |
| Standard Deviation (Population) | 7.8% | 10.3% |
Demographics Similar to Moroccans and Kenyans by Currently Married
In terms of currently married, the demographic groups most similar to Moroccans are Cuban (44.6%, a difference of 0.080%), Seminole (44.6%, a difference of 0.080%), Alaskan Athabascan (44.6%, a difference of 0.090%), Immigrants from Mexico (44.5%, a difference of 0.14%), and Iroquois (44.7%, a difference of 0.25%). Similarly, the demographic groups most similar to Kenyans are Mexican (45.2%, a difference of 0.020%), Immigrants from Portugal (45.2%, a difference of 0.13%), Immigrants from the Azores (45.1%, a difference of 0.22%), Immigrants from Laos (45.0%, a difference of 0.30%), and Immigrants from Uganda (45.0%, a difference of 0.34%).
| Demographics | Rating | Rank | Currently Married |
| Immigrants | Portugal | 3.5 /100 | #219 | Tragic 45.2% |
| Kenyans | 3.1 /100 | #220 | Tragic 45.2% |
| Mexicans | 3.0 /100 | #221 | Tragic 45.2% |
| Immigrants | Azores | 2.5 /100 | #222 | Tragic 45.1% |
| Immigrants | Laos | 2.3 /100 | #223 | Tragic 45.0% |
| Immigrants | Uganda | 2.2 /100 | #224 | Tragic 45.0% |
| French American Indians | 2.2 /100 | #225 | Tragic 45.0% |
| Comanche | 2.1 /100 | #226 | Tragic 45.0% |
| Spanish Americans | 2.1 /100 | #227 | Tragic 45.0% |
| Immigrants | Uruguay | 2.0 /100 | #228 | Tragic 45.0% |
| Cree | 1.7 /100 | #229 | Tragic 44.9% |
| Immigrants | Kenya | 1.6 /100 | #230 | Tragic 44.9% |
| Immigrants | Panama | 1.5 /100 | #231 | Tragic 44.9% |
| Nepalese | 1.2 /100 | #232 | Tragic 44.7% |
| Immigrants | Saudi Arabia | 1.1 /100 | #233 | Tragic 44.7% |
| Iroquois | 1.1 /100 | #234 | Tragic 44.7% |
| Alaskan Athabascans | 0.9 /100 | #235 | Tragic 44.6% |
| Cubans | 0.9 /100 | #236 | Tragic 44.6% |
| Seminole | 0.9 /100 | #237 | Tragic 44.6% |
| Moroccans | 0.9 /100 | #238 | Tragic 44.6% |
| Immigrants | Mexico | 0.7 /100 | #239 | Tragic 44.5% |