Moroccan vs Immigrants from Guatemala Average Family Size
COMPARE
Moroccan
Immigrants from Guatemala
Average Family Size
Average Family Size Comparison
Moroccans
Immigrants from Guatemala
3.22
AVERAGE FAMILY SIZE
44.2/ 100
METRIC RATING
182nd/ 347
METRIC RANK
3.41
AVERAGE FAMILY SIZE
100.0/ 100
METRIC RATING
32nd/ 347
METRIC RANK
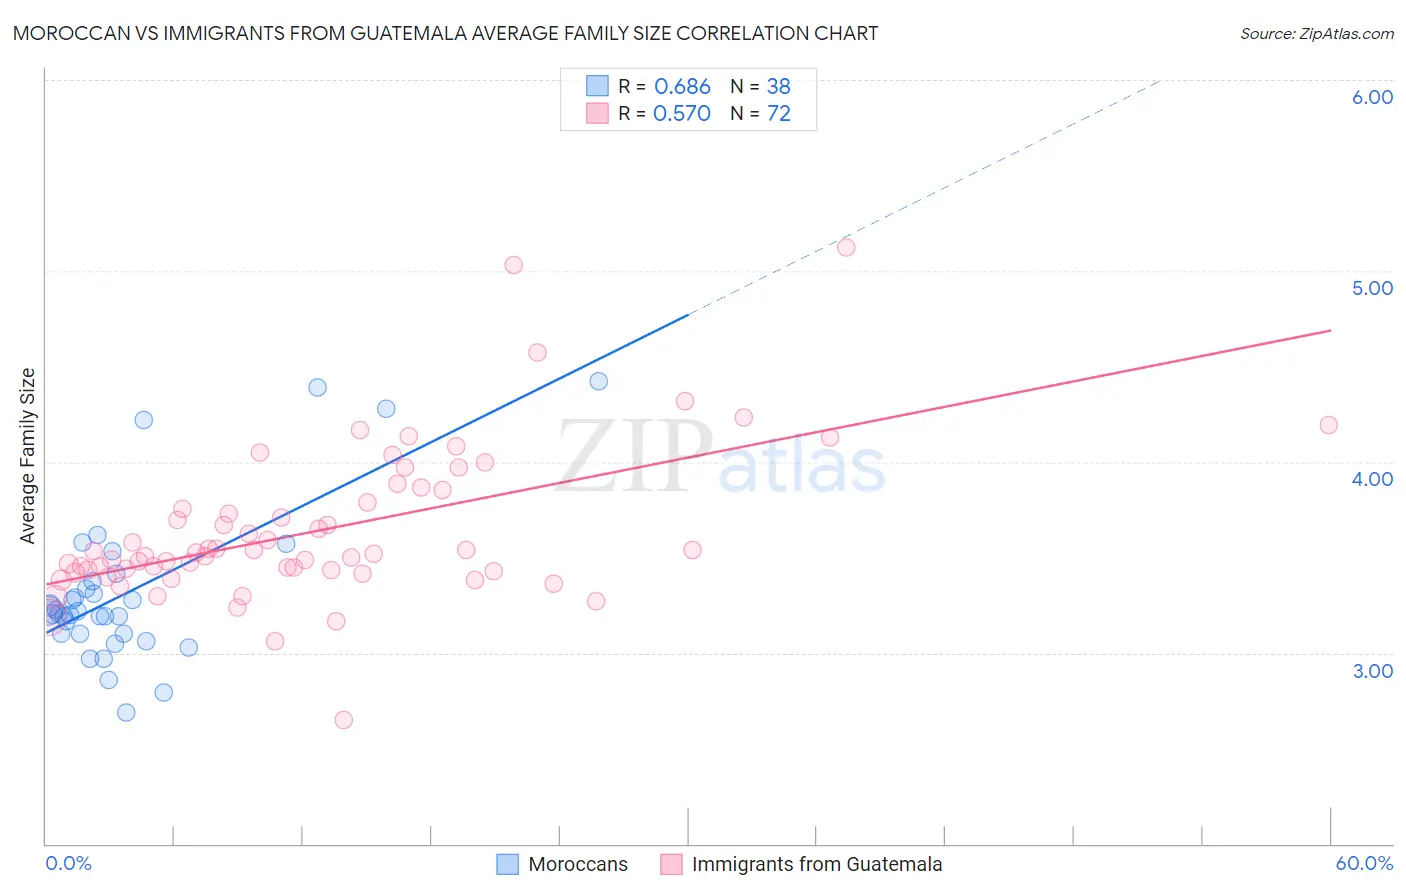
Moroccan vs Immigrants from Guatemala Average Family Size Correlation Chart
The statistical analysis conducted on geographies consisting of 201,760,507 people shows a significant positive correlation between the proportion of Moroccans and average family size in the United States with a correlation coefficient (R) of 0.686 and weighted average of 3.22. Similarly, the statistical analysis conducted on geographies consisting of 377,174,912 people shows a substantial positive correlation between the proportion of Immigrants from Guatemala and average family size in the United States with a correlation coefficient (R) of 0.570 and weighted average of 3.41, a difference of 5.7%.
Average Family Size Correlation Summary
| Measurement | Moroccan | Immigrants from Guatemala |
| Minimum | 2.69 | 2.65 |
| Maximum | 4.42 | 5.12 |
| Range | 1.73 | 2.47 |
| Mean | 3.32 | 3.64 |
| Median | 3.21 | 3.52 |
| Interquartile 25% (IQ1) | 3.10 | 3.43 |
| Interquartile 75% (IQ3) | 3.38 | 3.82 |
| Interquartile Range (IQR) | 0.28 | 0.39 |
| Standard Deviation (Sample) | 0.40 | 0.40 |
| Standard Deviation (Population) | 0.40 | 0.40 |
Similar Demographics by Average Family Size
Demographics Similar to Moroccans by Average Family Size
In terms of average family size, the demographic groups most similar to Moroccans are Spanish (3.23, a difference of 0.010%), Palestinian (3.23, a difference of 0.040%), Spaniard (3.23, a difference of 0.050%), Immigrants from Korea (3.23, a difference of 0.050%), and Immigrants from Northern Africa (3.22, a difference of 0.050%).
| Demographics | Rating | Rank | Average Family Size |
| Immigrants | China | 49.9 /100 | #175 | Average 3.23 |
| Israelis | 48.7 /100 | #176 | Average 3.23 |
| Argentineans | 47.4 /100 | #177 | Average 3.23 |
| Spaniards | 47.2 /100 | #178 | Average 3.23 |
| Immigrants | Korea | 46.9 /100 | #179 | Average 3.23 |
| Palestinians | 46.6 /100 | #180 | Average 3.23 |
| Spanish | 44.8 /100 | #181 | Average 3.23 |
| Moroccans | 44.2 /100 | #182 | Average 3.22 |
| Immigrants | Northern Africa | 41.7 /100 | #183 | Average 3.22 |
| Immigrants | Eastern Asia | 40.8 /100 | #184 | Average 3.22 |
| Immigrants | Sri Lanka | 39.8 /100 | #185 | Fair 3.22 |
| Immigrants | Argentina | 39.8 /100 | #186 | Fair 3.22 |
| Immigrants | Malaysia | 39.0 /100 | #187 | Fair 3.22 |
| Thais | 38.3 /100 | #188 | Fair 3.22 |
| Pakistanis | 33.7 /100 | #189 | Fair 3.22 |
Demographics Similar to Immigrants from Guatemala by Average Family Size
In terms of average family size, the demographic groups most similar to Immigrants from Guatemala are Hawaiian (3.41, a difference of 0.030%), Hispanic or Latino (3.41, a difference of 0.080%), Central American (3.41, a difference of 0.10%), Guatemalan (3.40, a difference of 0.14%), and Immigrants from Guyana (3.40, a difference of 0.19%).
| Demographics | Rating | Rank | Average Family Size |
| Yakama | 100.0 /100 | #25 | Exceptional 3.45 |
| Native Hawaiians | 100.0 /100 | #26 | Exceptional 3.43 |
| Mexican American Indians | 100.0 /100 | #27 | Exceptional 3.43 |
| Immigrants | Latin America | 100.0 /100 | #28 | Exceptional 3.42 |
| Nepalese | 100.0 /100 | #29 | Exceptional 3.42 |
| Samoans | 100.0 /100 | #30 | Exceptional 3.42 |
| Central Americans | 100.0 /100 | #31 | Exceptional 3.41 |
| Immigrants | Guatemala | 100.0 /100 | #32 | Exceptional 3.41 |
| Hawaiians | 100.0 /100 | #33 | Exceptional 3.41 |
| Hispanics or Latinos | 100.0 /100 | #34 | Exceptional 3.41 |
| Guatemalans | 100.0 /100 | #35 | Exceptional 3.40 |
| Immigrants | Guyana | 100.0 /100 | #36 | Exceptional 3.40 |
| Guyanese | 100.0 /100 | #37 | Exceptional 3.40 |
| Immigrants | Belize | 100.0 /100 | #38 | Exceptional 3.39 |
| Immigrants | Haiti | 100.0 /100 | #39 | Exceptional 3.39 |