Mongolian vs Panamanian Single Mother Households
COMPARE
Mongolian
Panamanian
Single Mother Households
Single Mother Households Comparison
Mongolians
Panamanians
5.8%
SINGLE MOTHER HOUSEHOLDS
95.3/ 100
METRIC RATING
113th/ 347
METRIC RANK
7.1%
SINGLE MOTHER HOUSEHOLDS
0.9/ 100
METRIC RATING
238th/ 347
METRIC RANK
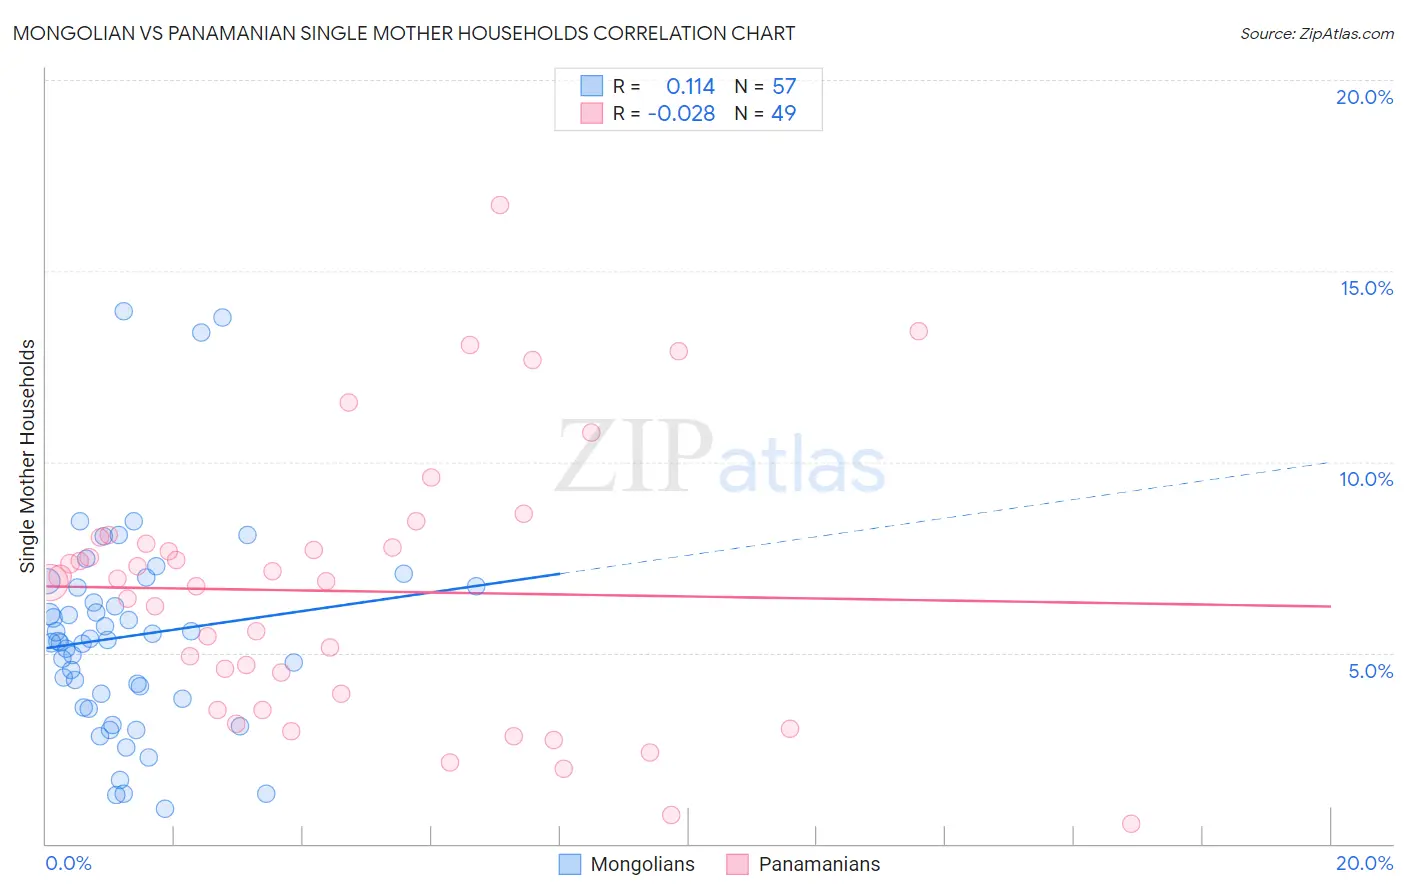
Mongolian vs Panamanian Single Mother Households Correlation Chart
The statistical analysis conducted on geographies consisting of 140,225,354 people shows a poor positive correlation between the proportion of Mongolians and percentage of single mother households in the United States with a correlation coefficient (R) of 0.114 and weighted average of 5.8%. Similarly, the statistical analysis conducted on geographies consisting of 280,762,519 people shows no correlation between the proportion of Panamanians and percentage of single mother households in the United States with a correlation coefficient (R) of -0.028 and weighted average of 7.1%, a difference of 23.0%.
Single Mother Households Correlation Summary
| Measurement | Mongolian | Panamanian |
| Minimum | 0.92% | 0.51% |
| Maximum | 14.0% | 16.7% |
| Range | 13.0% | 16.2% |
| Mean | 5.4% | 6.6% |
| Median | 5.3% | 6.9% |
| Interquartile 25% (IQ1) | 3.7% | 3.7% |
| Interquartile 75% (IQ3) | 6.7% | 7.9% |
| Interquartile Range (IQR) | 3.0% | 4.2% |
| Standard Deviation (Sample) | 2.7% | 3.5% |
| Standard Deviation (Population) | 2.7% | 3.5% |
Similar Demographics by Single Mother Households
Demographics Similar to Mongolians by Single Mother Households
In terms of single mother households, the demographic groups most similar to Mongolians are Immigrants from Kuwait (5.8%, a difference of 0.070%), Immigrants from England (5.8%, a difference of 0.11%), Dutch (5.8%, a difference of 0.13%), British (5.8%, a difference of 0.14%), and Immigrants from Western Europe (5.8%, a difference of 0.23%).
| Demographics | Rating | Rank | Single Mother Households |
| Immigrants | Ukraine | 95.9 /100 | #106 | Exceptional 5.8% |
| Paraguayans | 95.8 /100 | #107 | Exceptional 5.8% |
| Immigrants | Italy | 95.8 /100 | #108 | Exceptional 5.8% |
| Immigrants | Western Europe | 95.7 /100 | #109 | Exceptional 5.8% |
| British | 95.5 /100 | #110 | Exceptional 5.8% |
| Immigrants | England | 95.5 /100 | #111 | Exceptional 5.8% |
| Immigrants | Kuwait | 95.4 /100 | #112 | Exceptional 5.8% |
| Mongolians | 95.3 /100 | #113 | Exceptional 5.8% |
| Dutch | 95.1 /100 | #114 | Exceptional 5.8% |
| Irish | 94.8 /100 | #115 | Exceptional 5.8% |
| Pennsylvania Germans | 94.7 /100 | #116 | Exceptional 5.8% |
| Bolivians | 94.6 /100 | #117 | Exceptional 5.8% |
| Laotians | 94.3 /100 | #118 | Exceptional 5.8% |
| South Africans | 94.1 /100 | #119 | Exceptional 5.8% |
| Tongans | 93.7 /100 | #120 | Exceptional 5.8% |
Demographics Similar to Panamanians by Single Mother Households
In terms of single mother households, the demographic groups most similar to Panamanians are Arapaho (7.1%, a difference of 0.14%), Ute (7.1%, a difference of 0.23%), Kiowa (7.1%, a difference of 0.27%), Immigrants from Panama (7.2%, a difference of 0.59%), and Immigrants from Portugal (7.2%, a difference of 0.94%).
| Demographics | Rating | Rank | Single Mother Households |
| Spanish Americans | 1.6 /100 | #231 | Tragic 7.0% |
| Comanche | 1.5 /100 | #232 | Tragic 7.0% |
| Choctaw | 1.4 /100 | #233 | Tragic 7.0% |
| Chickasaw | 1.4 /100 | #234 | Tragic 7.0% |
| Immigrants | Burma/Myanmar | 1.4 /100 | #235 | Tragic 7.0% |
| Ute | 1.0 /100 | #236 | Tragic 7.1% |
| Arapaho | 1.0 /100 | #237 | Tragic 7.1% |
| Panamanians | 0.9 /100 | #238 | Tragic 7.1% |
| Kiowa | 0.8 /100 | #239 | Tragic 7.1% |
| Immigrants | Panama | 0.7 /100 | #240 | Tragic 7.2% |
| Immigrants | Portugal | 0.6 /100 | #241 | Tragic 7.2% |
| Fijians | 0.6 /100 | #242 | Tragic 7.2% |
| Ecuadorians | 0.6 /100 | #243 | Tragic 7.2% |
| Cubans | 0.6 /100 | #244 | Tragic 7.2% |
| Immigrants | Cambodia | 0.5 /100 | #245 | Tragic 7.2% |