Mongolian vs Belgian Births to Unmarried Women
COMPARE
Mongolian
Belgian
Births to Unmarried Women
Births to Unmarried Women Comparison
Mongolians
Belgians
27.9%
BIRTHS TO UNMARRIED WOMEN
99.3/ 100
METRIC RATING
55th/ 347
METRIC RANK
31.6%
BIRTHS TO UNMARRIED WOMEN
52.4/ 100
METRIC RATING
168th/ 347
METRIC RANK
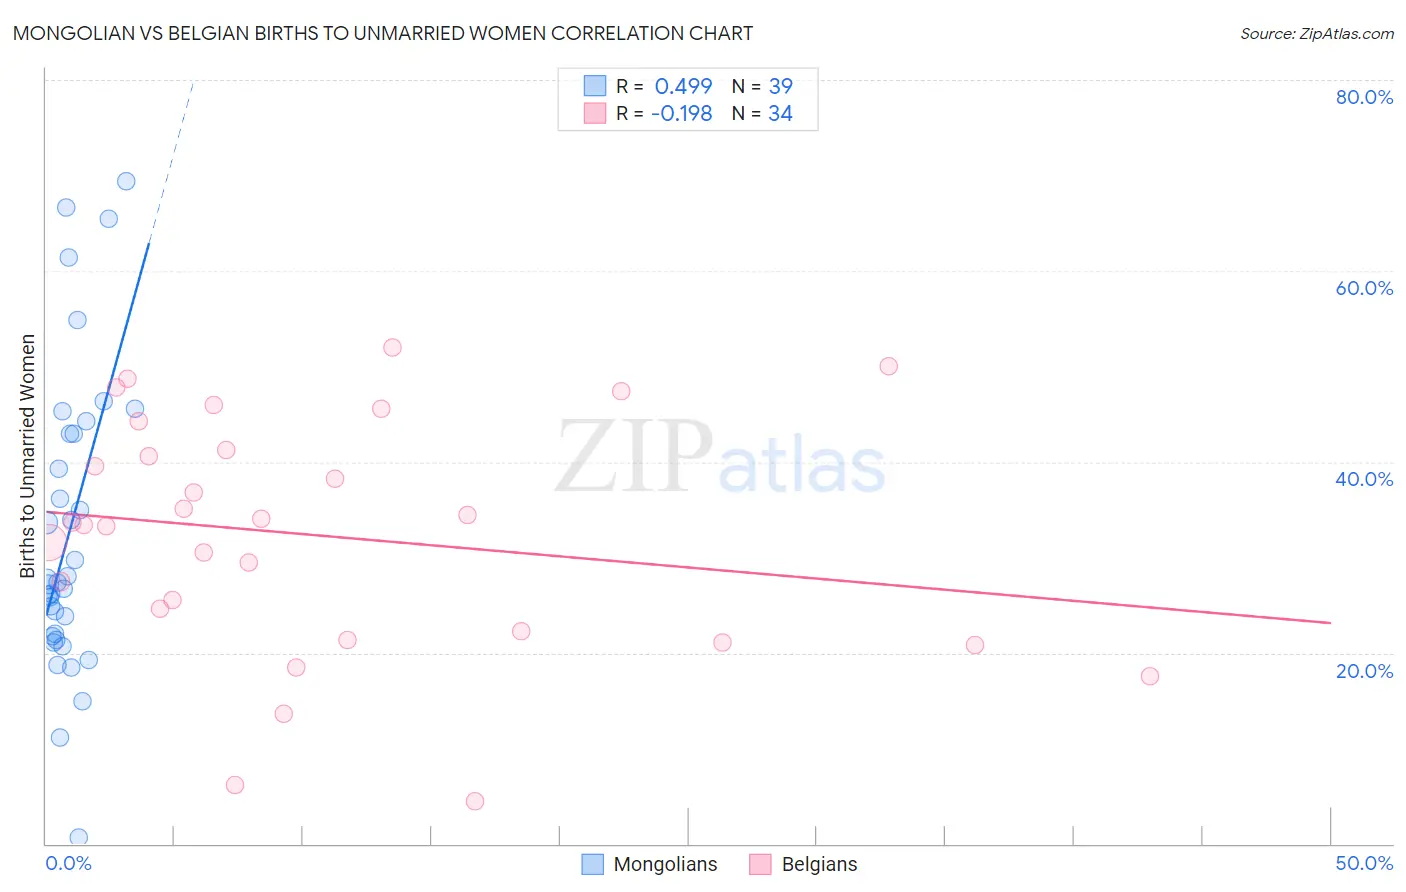
Mongolian vs Belgian Births to Unmarried Women Correlation Chart
The statistical analysis conducted on geographies consisting of 135,823,191 people shows a moderate positive correlation between the proportion of Mongolians and percentage of births to unmarried women in the United States with a correlation coefficient (R) of 0.499 and weighted average of 27.9%. Similarly, the statistical analysis conducted on geographies consisting of 329,841,435 people shows a poor negative correlation between the proportion of Belgians and percentage of births to unmarried women in the United States with a correlation coefficient (R) of -0.198 and weighted average of 31.6%, a difference of 13.2%.
Births to Unmarried Women Correlation Summary
| Measurement | Mongolian | Belgian |
| Minimum | 0.60% | 4.4% |
| Maximum | 69.4% | 52.0% |
| Range | 68.8% | 47.6% |
| Mean | 32.6% | 32.3% |
| Median | 27.3% | 33.5% |
| Interquartile 25% (IQ1) | 21.7% | 22.3% |
| Interquartile 75% (IQ3) | 42.9% | 41.2% |
| Interquartile Range (IQR) | 21.2% | 19.0% |
| Standard Deviation (Sample) | 15.7% | 12.4% |
| Standard Deviation (Population) | 15.5% | 12.2% |
Similar Demographics by Births to Unmarried Women
Demographics Similar to Mongolians by Births to Unmarried Women
In terms of births to unmarried women, the demographic groups most similar to Mongolians are Afghan (27.9%, a difference of 0.040%), Immigrants from Romania (27.9%, a difference of 0.11%), Bhutanese (27.9%, a difference of 0.12%), Macedonian (27.9%, a difference of 0.16%), and Immigrants from Belgium (28.0%, a difference of 0.26%).
| Demographics | Rating | Rank | Births to Unmarried Women |
| Eastern Europeans | 99.5 /100 | #48 | Exceptional 27.7% |
| Immigrants | Greece | 99.4 /100 | #49 | Exceptional 27.8% |
| Maltese | 99.4 /100 | #50 | Exceptional 27.8% |
| Macedonians | 99.4 /100 | #51 | Exceptional 27.9% |
| Bhutanese | 99.4 /100 | #52 | Exceptional 27.9% |
| Immigrants | Romania | 99.4 /100 | #53 | Exceptional 27.9% |
| Afghans | 99.4 /100 | #54 | Exceptional 27.9% |
| Mongolians | 99.3 /100 | #55 | Exceptional 27.9% |
| Immigrants | Belgium | 99.3 /100 | #56 | Exceptional 28.0% |
| Russians | 99.2 /100 | #57 | Exceptional 28.0% |
| Immigrants | Albania | 99.2 /100 | #58 | Exceptional 28.0% |
| Immigrants | Kazakhstan | 99.1 /100 | #59 | Exceptional 28.1% |
| Immigrants | Turkey | 99.1 /100 | #60 | Exceptional 28.1% |
| Immigrants | North Macedonia | 99.1 /100 | #61 | Exceptional 28.1% |
| Egyptians | 99.0 /100 | #62 | Exceptional 28.2% |
Demographics Similar to Belgians by Births to Unmarried Women
In terms of births to unmarried women, the demographic groups most similar to Belgians are Slavic (31.6%, a difference of 0.030%), Guamanian/Chamorro (31.6%, a difference of 0.10%), Finnish (31.7%, a difference of 0.18%), Immigrants from Eritrea (31.7%, a difference of 0.19%), and Immigrants from Yemen (31.7%, a difference of 0.20%).
| Demographics | Rating | Rank | Births to Unmarried Women |
| Immigrants | Southern Europe | 68.7 /100 | #161 | Good 31.1% |
| Slovenes | 65.9 /100 | #162 | Good 31.2% |
| Immigrants | Chile | 65.7 /100 | #163 | Good 31.2% |
| Hungarians | 64.1 /100 | #164 | Good 31.2% |
| Immigrants | Somalia | 58.1 /100 | #165 | Average 31.4% |
| Peruvians | 55.5 /100 | #166 | Average 31.5% |
| Dutch | 55.3 /100 | #167 | Average 31.5% |
| Belgians | 52.4 /100 | #168 | Average 31.6% |
| Slavs | 52.0 /100 | #169 | Average 31.6% |
| Guamanians/Chamorros | 51.3 /100 | #170 | Average 31.6% |
| Finns | 50.5 /100 | #171 | Average 31.7% |
| Immigrants | Eritrea | 50.4 /100 | #172 | Average 31.7% |
| Immigrants | Yemen | 50.2 /100 | #173 | Average 31.7% |
| Venezuelans | 50.0 /100 | #174 | Average 31.7% |
| Immigrants | Venezuela | 49.2 /100 | #175 | Average 31.7% |