Marshallese vs Black/African American Family Households
COMPARE
Marshallese
Black/African American
Family Households
Family Households Comparison
Marshallese
Blacks/African Americans
63.7%
FAMILY HOUSEHOLDS
6.9/ 100
METRIC RATING
218th/ 347
METRIC RANK
61.5%
FAMILY HOUSEHOLDS
0.0/ 100
METRIC RATING
327th/ 347
METRIC RANK
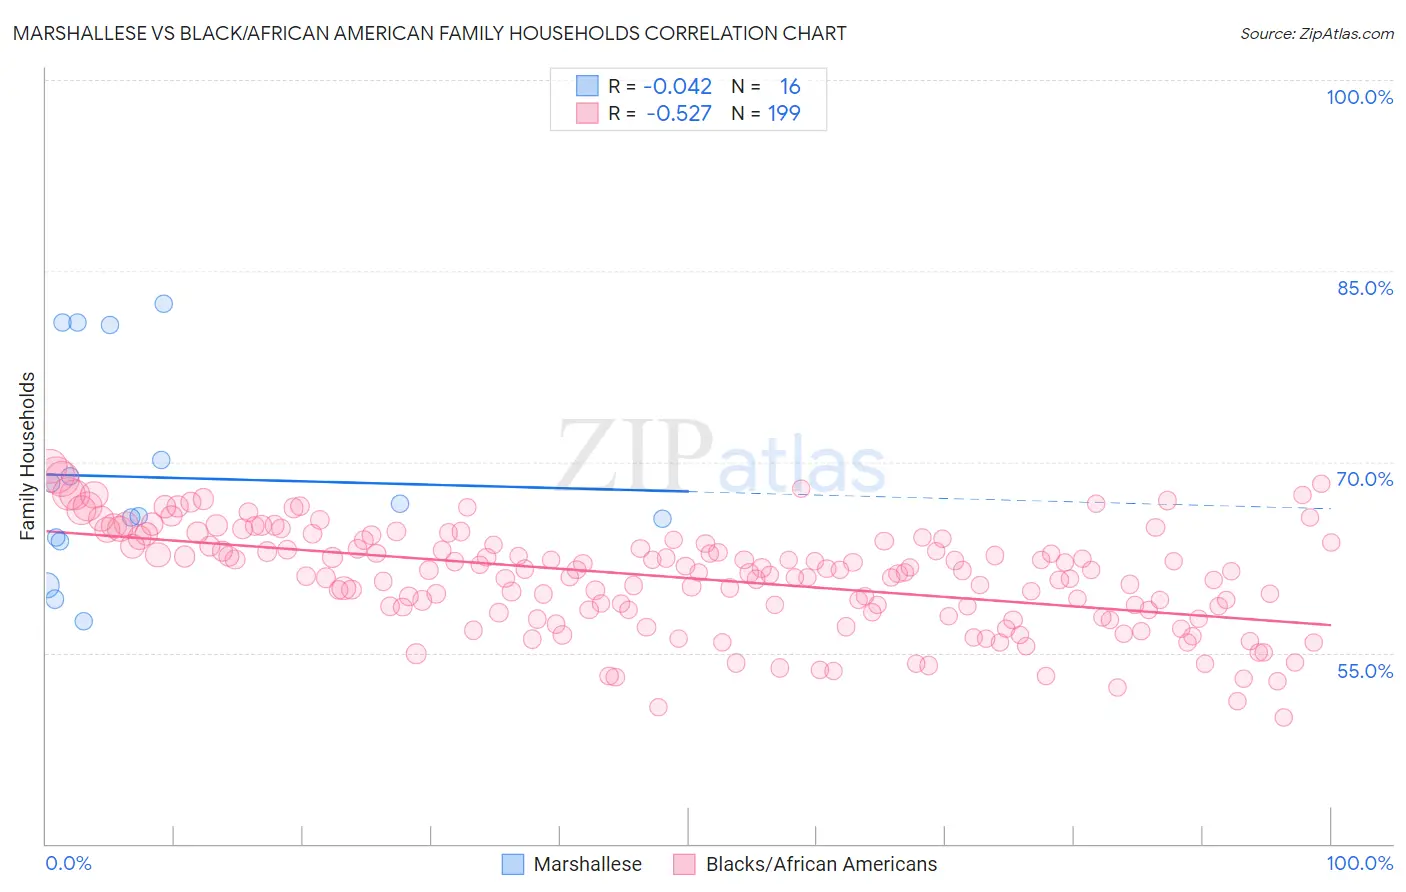
Marshallese vs Black/African American Family Households Correlation Chart
The statistical analysis conducted on geographies consisting of 14,761,315 people shows no correlation between the proportion of Marshallese and percentage of family households in the United States with a correlation coefficient (R) of -0.042 and weighted average of 63.7%. Similarly, the statistical analysis conducted on geographies consisting of 565,332,954 people shows a substantial negative correlation between the proportion of Blacks/African Americans and percentage of family households in the United States with a correlation coefficient (R) of -0.527 and weighted average of 61.5%, a difference of 3.7%.
Family Households Correlation Summary
| Measurement | Marshallese | Black/African American |
| Minimum | 57.4% | 49.9% |
| Maximum | 82.4% | 69.6% |
| Range | 25.0% | 19.8% |
| Mean | 68.8% | 60.9% |
| Median | 66.2% | 61.4% |
| Interquartile 25% (IQ1) | 63.9% | 58.4% |
| Interquartile 75% (IQ3) | 75.4% | 63.8% |
| Interquartile Range (IQR) | 11.5% | 5.4% |
| Standard Deviation (Sample) | 8.2% | 4.0% |
| Standard Deviation (Population) | 7.9% | 4.0% |
Similar Demographics by Family Households
Demographics Similar to Marshallese by Family Households
In terms of family households, the demographic groups most similar to Marshallese are Osage (63.7%, a difference of 0.0%), Croatian (63.8%, a difference of 0.020%), Belgian (63.8%, a difference of 0.030%), Macedonian (63.7%, a difference of 0.030%), and Immigrants from Europe (63.7%, a difference of 0.030%).
| Demographics | Rating | Rank | Family Households |
| Shoshone | 9.4 /100 | #211 | Tragic 63.8% |
| Immigrants | Netherlands | 9.4 /100 | #212 | Tragic 63.8% |
| Immigrants | Northern Europe | 8.8 /100 | #213 | Tragic 63.8% |
| Celtics | 8.0 /100 | #214 | Tragic 63.8% |
| Belgians | 7.6 /100 | #215 | Tragic 63.8% |
| Croatians | 7.3 /100 | #216 | Tragic 63.8% |
| Osage | 7.0 /100 | #217 | Tragic 63.7% |
| Marshallese | 6.9 /100 | #218 | Tragic 63.7% |
| Macedonians | 6.5 /100 | #219 | Tragic 63.7% |
| Immigrants | Europe | 6.4 /100 | #220 | Tragic 63.7% |
| Immigrants | South Africa | 5.9 /100 | #221 | Tragic 63.7% |
| Immigrants | Belarus | 5.5 /100 | #222 | Tragic 63.7% |
| French Canadians | 5.4 /100 | #223 | Tragic 63.7% |
| Turks | 4.5 /100 | #224 | Tragic 63.6% |
| Immigrants | Hungary | 4.3 /100 | #225 | Tragic 63.6% |
Demographics Similar to Blacks/African Americans by Family Households
In terms of family households, the demographic groups most similar to Blacks/African Americans are Indonesian (61.5%, a difference of 0.020%), Kiowa (61.4%, a difference of 0.13%), Cambodian (61.4%, a difference of 0.15%), Immigrants from Switzerland (61.6%, a difference of 0.21%), and Immigrants from West Indies (61.6%, a difference of 0.22%).
| Demographics | Rating | Rank | Family Households |
| Ugandans | 0.0 /100 | #320 | Tragic 61.7% |
| Alsatians | 0.0 /100 | #321 | Tragic 61.7% |
| Immigrants | Serbia | 0.0 /100 | #322 | Tragic 61.6% |
| Tlingit-Haida | 0.0 /100 | #323 | Tragic 61.6% |
| Immigrants | West Indies | 0.0 /100 | #324 | Tragic 61.6% |
| Immigrants | Switzerland | 0.0 /100 | #325 | Tragic 61.6% |
| Indonesians | 0.0 /100 | #326 | Tragic 61.5% |
| Blacks/African Americans | 0.0 /100 | #327 | Tragic 61.5% |
| Kiowa | 0.0 /100 | #328 | Tragic 61.4% |
| Cambodians | 0.0 /100 | #329 | Tragic 61.4% |
| Immigrants | Australia | 0.0 /100 | #330 | Tragic 61.3% |
| Immigrants | France | 0.0 /100 | #331 | Tragic 61.3% |
| Ethiopians | 0.0 /100 | #332 | Tragic 61.2% |
| Immigrants | Ethiopia | 0.0 /100 | #333 | Tragic 61.2% |
| Immigrants | Eastern Africa | 0.0 /100 | #334 | Tragic 61.1% |