Maltese vs Immigrants from Eritrea Currently Married
COMPARE
Maltese
Immigrants from Eritrea
Currently Married
Currently Married Comparison
Maltese
Immigrants from Eritrea
49.0%
CURRENTLY MARRIED
99.6/ 100
METRIC RATING
25th/ 347
METRIC RANK
43.6%
CURRENTLY MARRIED
0.1/ 100
METRIC RATING
267th/ 347
METRIC RANK
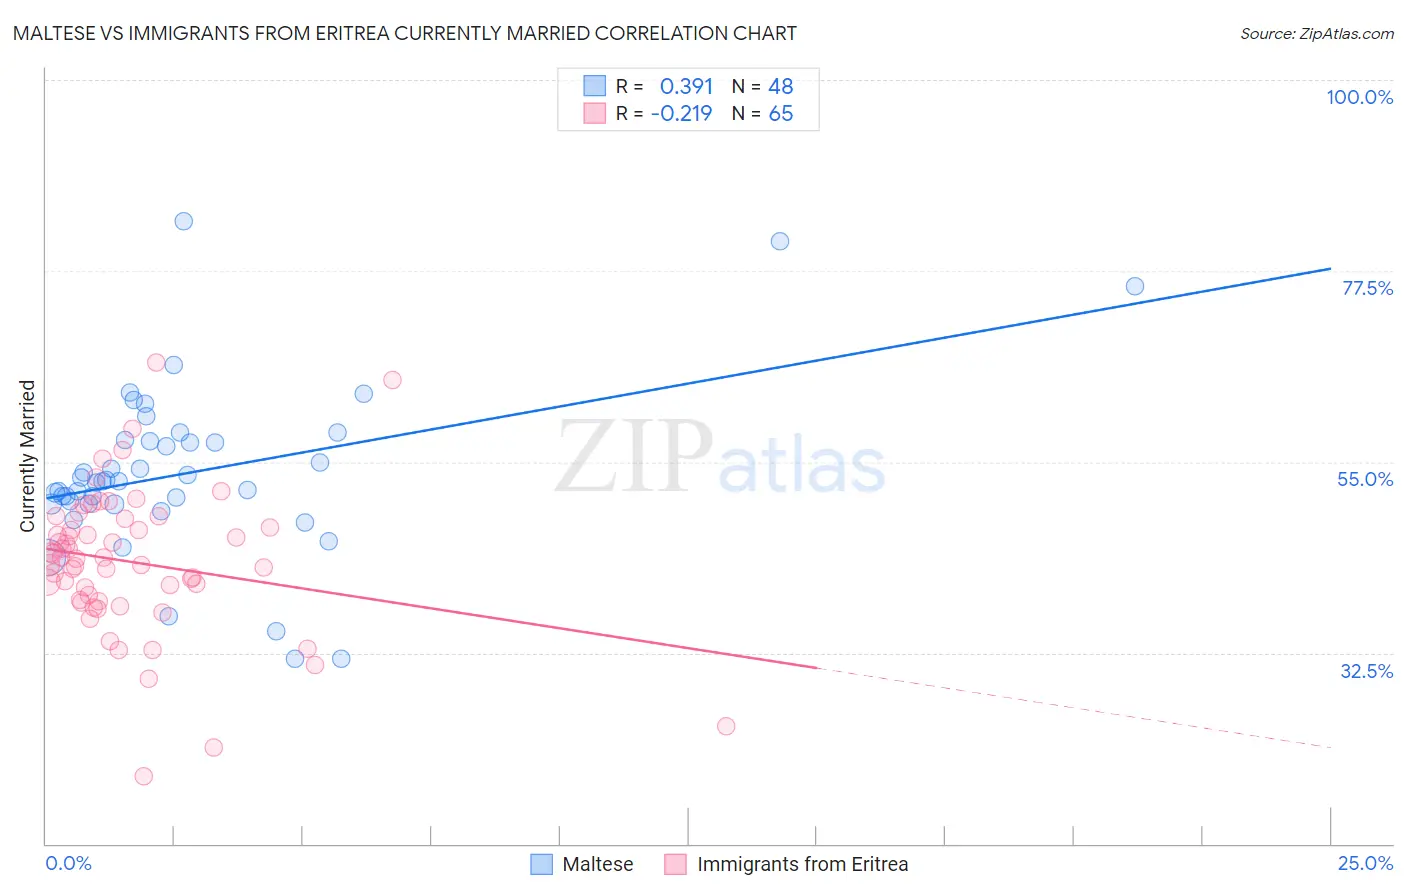
Maltese vs Immigrants from Eritrea Currently Married Correlation Chart
The statistical analysis conducted on geographies consisting of 126,466,050 people shows a mild positive correlation between the proportion of Maltese and percentage of population currently married in the United States with a correlation coefficient (R) of 0.391 and weighted average of 49.0%. Similarly, the statistical analysis conducted on geographies consisting of 104,847,164 people shows a weak negative correlation between the proportion of Immigrants from Eritrea and percentage of population currently married in the United States with a correlation coefficient (R) of -0.219 and weighted average of 43.6%, a difference of 12.4%.
Currently Married Correlation Summary
| Measurement | Maltese | Immigrants from Eritrea |
| Minimum | 31.8% | 17.9% |
| Maximum | 83.3% | 66.7% |
| Range | 51.5% | 48.8% |
| Mean | 53.8% | 43.2% |
| Median | 52.8% | 43.6% |
| Interquartile 25% (IQ1) | 50.0% | 38.6% |
| Interquartile 75% (IQ3) | 57.5% | 47.8% |
| Interquartile Range (IQR) | 7.5% | 9.2% |
| Standard Deviation (Sample) | 10.1% | 8.6% |
| Standard Deviation (Population) | 10.0% | 8.6% |
Similar Demographics by Currently Married
Demographics Similar to Maltese by Currently Married
In terms of currently married, the demographic groups most similar to Maltese are Lithuanian (49.0%, a difference of 0.010%), Immigrants from Korea (49.0%, a difference of 0.050%), Immigrants from Pakistan (49.1%, a difference of 0.12%), Burmese (48.9%, a difference of 0.12%), and Welsh (48.9%, a difference of 0.16%).
| Demographics | Rating | Rank | Currently Married |
| Immigrants | Scotland | 99.8 /100 | #18 | Exceptional 49.3% |
| Europeans | 99.8 /100 | #19 | Exceptional 49.3% |
| Luxembourgers | 99.8 /100 | #20 | Exceptional 49.3% |
| Scottish | 99.8 /100 | #21 | Exceptional 49.2% |
| Bulgarians | 99.7 /100 | #22 | Exceptional 49.1% |
| Immigrants | Pakistan | 99.7 /100 | #23 | Exceptional 49.1% |
| Lithuanians | 99.6 /100 | #24 | Exceptional 49.0% |
| Maltese | 99.6 /100 | #25 | Exceptional 49.0% |
| Immigrants | Korea | 99.6 /100 | #26 | Exceptional 49.0% |
| Burmese | 99.6 /100 | #27 | Exceptional 48.9% |
| Welsh | 99.5 /100 | #28 | Exceptional 48.9% |
| Croatians | 99.5 /100 | #29 | Exceptional 48.9% |
| Eastern Europeans | 99.5 /100 | #30 | Exceptional 48.9% |
| Poles | 99.5 /100 | #31 | Exceptional 48.9% |
| Immigrants | Hong Kong | 99.5 /100 | #32 | Exceptional 48.9% |
Demographics Similar to Immigrants from Eritrea by Currently Married
In terms of currently married, the demographic groups most similar to Immigrants from Eritrea are Spanish American Indian (43.6%, a difference of 0.0%), Ecuadorian (43.6%, a difference of 0.030%), Immigrants from Bangladesh (43.6%, a difference of 0.10%), Immigrants from Sudan (43.5%, a difference of 0.13%), and Sudanese (43.7%, a difference of 0.18%).
| Demographics | Rating | Rank | Currently Married |
| Immigrants | Latin America | 0.1 /100 | #260 | Tragic 43.8% |
| Immigrants | Nicaragua | 0.1 /100 | #261 | Tragic 43.7% |
| Bangladeshis | 0.1 /100 | #262 | Tragic 43.7% |
| Immigrants | Cuba | 0.1 /100 | #263 | Tragic 43.7% |
| Sudanese | 0.1 /100 | #264 | Tragic 43.7% |
| Immigrants | Bangladesh | 0.1 /100 | #265 | Tragic 43.6% |
| Ecuadorians | 0.1 /100 | #266 | Tragic 43.6% |
| Immigrants | Eritrea | 0.1 /100 | #267 | Tragic 43.6% |
| Spanish American Indians | 0.1 /100 | #268 | Tragic 43.6% |
| Immigrants | Sudan | 0.1 /100 | #269 | Tragic 43.5% |
| Salvadorans | 0.1 /100 | #270 | Tragic 43.5% |
| Bermudans | 0.1 /100 | #271 | Tragic 43.5% |
| Indonesians | 0.1 /100 | #272 | Tragic 43.5% |
| Yaqui | 0.1 /100 | #273 | Tragic 43.4% |
| Nigerians | 0.1 /100 | #274 | Tragic 43.4% |