Malaysian vs Native Hawaiian Single Mother Households
COMPARE
Malaysian
Native Hawaiian
Single Mother Households
Single Mother Households Comparison
Malaysians
Native Hawaiians
7.3%
SINGLE MOTHER HOUSEHOLDS
0.3/ 100
METRIC RATING
251st/ 347
METRIC RANK
6.1%
SINGLE MOTHER HOUSEHOLDS
75.0/ 100
METRIC RATING
156th/ 347
METRIC RANK
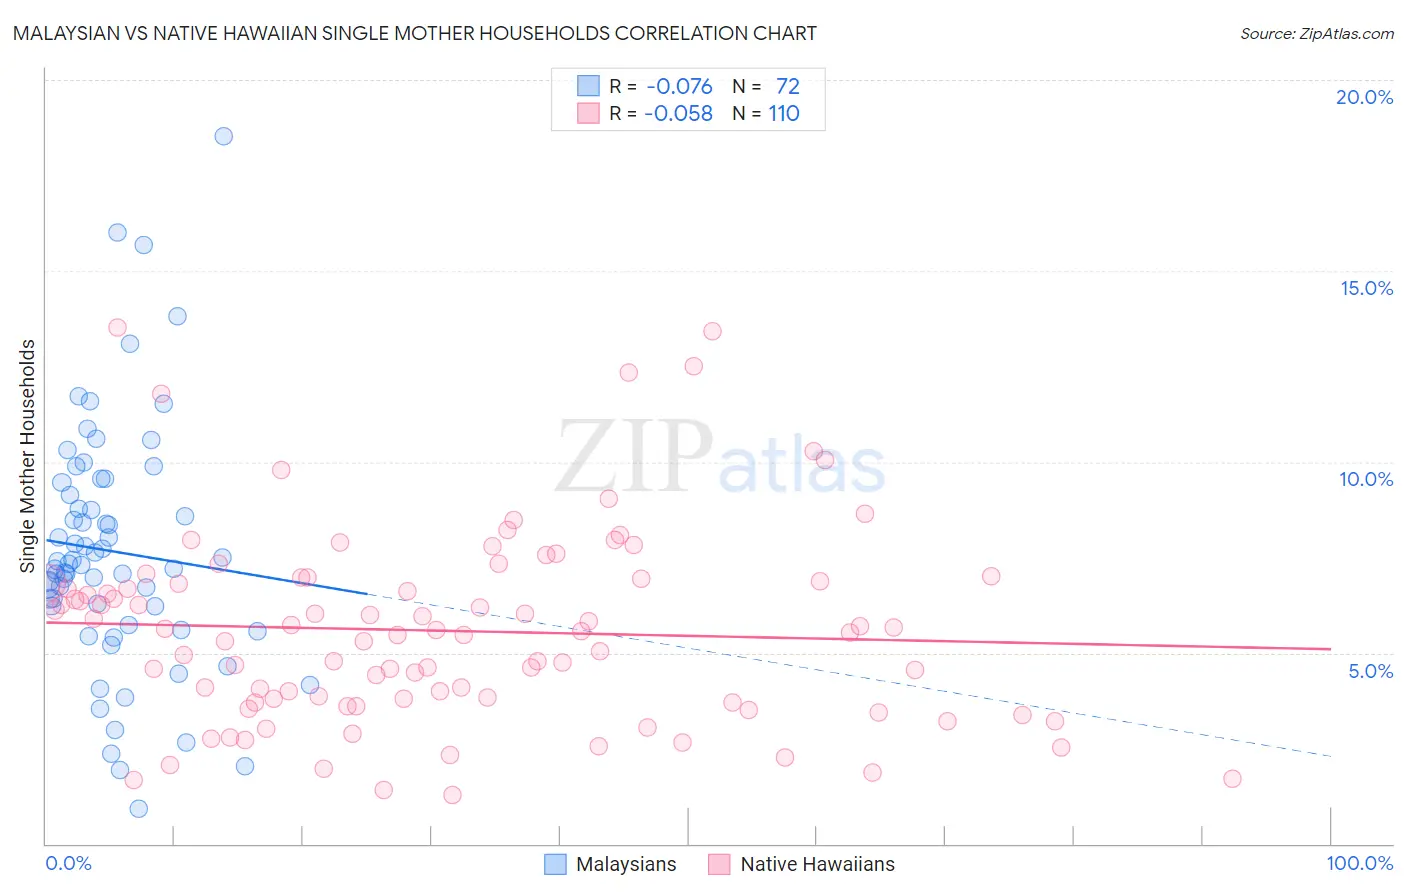
Malaysian vs Native Hawaiian Single Mother Households Correlation Chart
The statistical analysis conducted on geographies consisting of 225,856,339 people shows a slight negative correlation between the proportion of Malaysians and percentage of single mother households in the United States with a correlation coefficient (R) of -0.076 and weighted average of 7.3%. Similarly, the statistical analysis conducted on geographies consisting of 331,207,182 people shows a slight negative correlation between the proportion of Native Hawaiians and percentage of single mother households in the United States with a correlation coefficient (R) of -0.058 and weighted average of 6.1%, a difference of 19.4%.
Single Mother Households Correlation Summary
| Measurement | Malaysian | Native Hawaiian |
| Minimum | 0.92% | 1.3% |
| Maximum | 18.5% | 13.5% |
| Range | 17.6% | 12.2% |
| Mean | 7.7% | 5.6% |
| Median | 7.3% | 5.5% |
| Interquartile 25% (IQ1) | 6.0% | 3.7% |
| Interquartile 75% (IQ3) | 9.3% | 6.9% |
| Interquartile Range (IQR) | 3.3% | 3.1% |
| Standard Deviation (Sample) | 3.2% | 2.5% |
| Standard Deviation (Population) | 3.2% | 2.5% |
Similar Demographics by Single Mother Households
Demographics Similar to Malaysians by Single Mother Households
In terms of single mother households, the demographic groups most similar to Malaysians are Alaskan Athabascan (7.3%, a difference of 0.020%), Immigrants from Africa (7.3%, a difference of 0.34%), Bermudan (7.3%, a difference of 0.36%), Cajun (7.3%, a difference of 0.41%), and Immigrants from Ecuador (7.3%, a difference of 0.46%).
| Demographics | Rating | Rank | Single Mother Households |
| Cubans | 0.6 /100 | #244 | Tragic 7.2% |
| Immigrants | Cambodia | 0.5 /100 | #245 | Tragic 7.2% |
| Nicaraguans | 0.5 /100 | #246 | Tragic 7.2% |
| Dutch West Indians | 0.4 /100 | #247 | Tragic 7.3% |
| Spanish American Indians | 0.4 /100 | #248 | Tragic 7.3% |
| Bermudans | 0.4 /100 | #249 | Tragic 7.3% |
| Immigrants | Africa | 0.4 /100 | #250 | Tragic 7.3% |
| Malaysians | 0.3 /100 | #251 | Tragic 7.3% |
| Alaskan Athabascans | 0.3 /100 | #252 | Tragic 7.3% |
| Cajuns | 0.3 /100 | #253 | Tragic 7.3% |
| Immigrants | Ecuador | 0.3 /100 | #254 | Tragic 7.3% |
| Mexican American Indians | 0.2 /100 | #255 | Tragic 7.4% |
| Seminole | 0.2 /100 | #256 | Tragic 7.4% |
| Alaska Natives | 0.2 /100 | #257 | Tragic 7.4% |
| Pueblo | 0.2 /100 | #258 | Tragic 7.4% |
Demographics Similar to Native Hawaiians by Single Mother Households
In terms of single mother households, the demographic groups most similar to Native Hawaiians are Chilean (6.1%, a difference of 0.11%), White/Caucasian (6.1%, a difference of 0.23%), Celtic (6.1%, a difference of 0.24%), Yugoslavian (6.1%, a difference of 0.28%), and Iraqi (6.1%, a difference of 0.29%).
| Demographics | Rating | Rank | Single Mother Households |
| Immigrants | Albania | 81.5 /100 | #149 | Excellent 6.1% |
| Zimbabweans | 80.7 /100 | #150 | Excellent 6.1% |
| Immigrants | Southern Europe | 80.5 /100 | #151 | Excellent 6.1% |
| Pakistanis | 79.2 /100 | #152 | Good 6.1% |
| Immigrants | Brazil | 78.9 /100 | #153 | Good 6.1% |
| Immigrants | Philippines | 78.5 /100 | #154 | Good 6.1% |
| Whites/Caucasians | 76.5 /100 | #155 | Good 6.1% |
| Native Hawaiians | 75.0 /100 | #156 | Good 6.1% |
| Chileans | 74.2 /100 | #157 | Good 6.1% |
| Celtics | 73.3 /100 | #158 | Good 6.1% |
| Yugoslavians | 73.1 /100 | #159 | Good 6.1% |
| Iraqis | 73.0 /100 | #160 | Good 6.1% |
| Immigrants | Germany | 72.4 /100 | #161 | Good 6.1% |
| Immigrants | Zimbabwe | 69.9 /100 | #162 | Good 6.2% |
| Alsatians | 68.7 /100 | #163 | Good 6.2% |