Malaysian vs Immigrants from El Salvador Currently Married
COMPARE
Malaysian
Immigrants from El Salvador
Currently Married
Currently Married Comparison
Malaysians
Immigrants from El Salvador
45.9%
CURRENTLY MARRIED
15.3/ 100
METRIC RATING
201st/ 347
METRIC RANK
43.1%
CURRENTLY MARRIED
0.0/ 100
METRIC RATING
284th/ 347
METRIC RANK
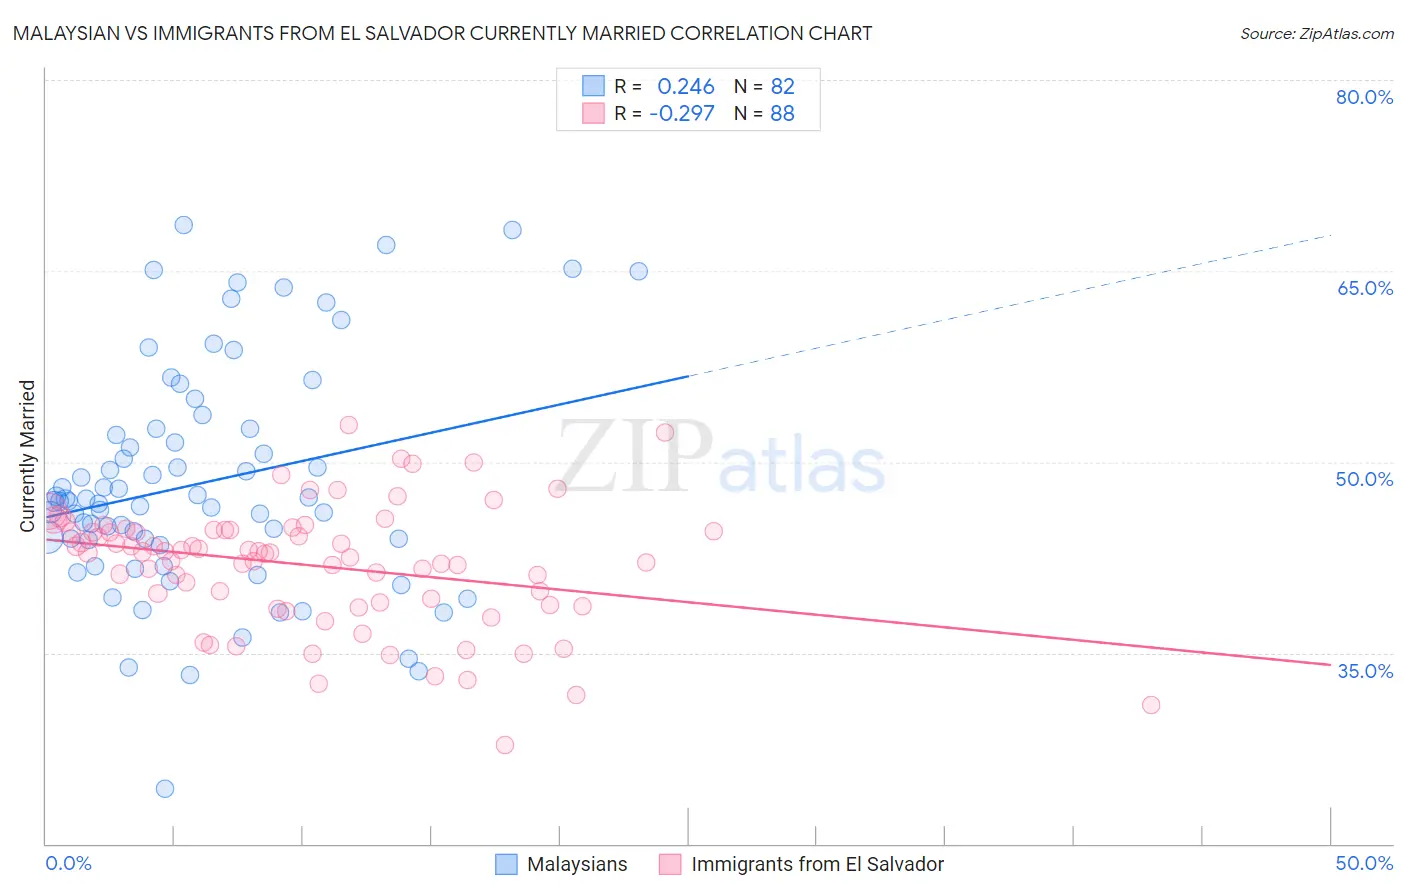
Malaysian vs Immigrants from El Salvador Currently Married Correlation Chart
The statistical analysis conducted on geographies consisting of 226,093,582 people shows a weak positive correlation between the proportion of Malaysians and percentage of population currently married in the United States with a correlation coefficient (R) of 0.246 and weighted average of 45.9%. Similarly, the statistical analysis conducted on geographies consisting of 357,815,519 people shows a weak negative correlation between the proportion of Immigrants from El Salvador and percentage of population currently married in the United States with a correlation coefficient (R) of -0.297 and weighted average of 43.1%, a difference of 6.4%.
Currently Married Correlation Summary
| Measurement | Malaysian | Immigrants from El Salvador |
| Minimum | 24.3% | 27.7% |
| Maximum | 68.6% | 52.9% |
| Range | 44.3% | 25.1% |
| Mean | 48.3% | 41.9% |
| Median | 46.9% | 42.9% |
| Interquartile 25% (IQ1) | 43.9% | 38.9% |
| Interquartile 75% (IQ3) | 52.6% | 44.7% |
| Interquartile Range (IQR) | 8.7% | 5.8% |
| Standard Deviation (Sample) | 8.9% | 4.8% |
| Standard Deviation (Population) | 8.9% | 4.8% |
Similar Demographics by Currently Married
Demographics Similar to Malaysians by Currently Married
In terms of currently married, the demographic groups most similar to Malaysians are Immigrants from Albania (45.9%, a difference of 0.060%), Creek (46.0%, a difference of 0.13%), Immigrants from Costa Rica (46.0%, a difference of 0.27%), Taiwanese (45.8%, a difference of 0.29%), and Immigrants from Spain (45.8%, a difference of 0.30%).
| Demographics | Rating | Rank | Currently Married |
| South Americans | 23.8 /100 | #194 | Fair 46.1% |
| Immigrants | Nepal | 23.7 /100 | #195 | Fair 46.1% |
| Immigrants | Bosnia and Herzegovina | 22.2 /100 | #196 | Fair 46.1% |
| Immigrants | Kuwait | 21.7 /100 | #197 | Fair 46.1% |
| Immigrants | Colombia | 21.0 /100 | #198 | Fair 46.1% |
| Immigrants | Costa Rica | 19.6 /100 | #199 | Poor 46.0% |
| Creek | 17.2 /100 | #200 | Poor 46.0% |
| Malaysians | 15.3 /100 | #201 | Poor 45.9% |
| Immigrants | Albania | 14.5 /100 | #202 | Poor 45.9% |
| Taiwanese | 11.7 /100 | #203 | Poor 45.8% |
| Immigrants | Spain | 11.6 /100 | #204 | Poor 45.8% |
| South American Indians | 11.5 /100 | #205 | Poor 45.8% |
| Immigrants | Immigrants | 11.2 /100 | #206 | Poor 45.8% |
| Immigrants | South America | 10.8 /100 | #207 | Poor 45.7% |
| Alsatians | 10.8 /100 | #208 | Poor 45.7% |
Demographics Similar to Immigrants from El Salvador by Currently Married
In terms of currently married, the demographic groups most similar to Immigrants from El Salvador are Kiowa (43.2%, a difference of 0.010%), Immigrants from Ecuador (43.2%, a difference of 0.12%), Apache (43.2%, a difference of 0.20%), Chippewa (43.2%, a difference of 0.20%), and Central American Indian (43.3%, a difference of 0.28%).
| Demographics | Rating | Rank | Currently Married |
| Immigrants | Nigeria | 0.1 /100 | #277 | Tragic 43.4% |
| Central Americans | 0.0 /100 | #278 | Tragic 43.3% |
| Central American Indians | 0.0 /100 | #279 | Tragic 43.3% |
| Apache | 0.0 /100 | #280 | Tragic 43.2% |
| Chippewa | 0.0 /100 | #281 | Tragic 43.2% |
| Immigrants | Ecuador | 0.0 /100 | #282 | Tragic 43.2% |
| Kiowa | 0.0 /100 | #283 | Tragic 43.2% |
| Immigrants | El Salvador | 0.0 /100 | #284 | Tragic 43.1% |
| Immigrants | Middle Africa | 0.0 /100 | #285 | Tragic 43.0% |
| Ghanaians | 0.0 /100 | #286 | Tragic 42.9% |
| Guatemalans | 0.0 /100 | #287 | Tragic 42.9% |
| Natives/Alaskans | 0.0 /100 | #288 | Tragic 42.8% |
| Paiute | 0.0 /100 | #289 | Tragic 42.7% |
| Immigrants | Ghana | 0.0 /100 | #290 | Tragic 42.7% |
| Immigrants | Guatemala | 0.0 /100 | #291 | Tragic 42.6% |