Macedonian vs Bulgarian Average Family Size
COMPARE
Macedonian
Bulgarian
Average Family Size
Average Family Size Comparison
Macedonians
Bulgarians
3.13
AVERAGE FAMILY SIZE
0.2/ 100
METRIC RATING
301st/ 347
METRIC RANK
3.13
AVERAGE FAMILY SIZE
0.1/ 100
METRIC RATING
313th/ 347
METRIC RANK
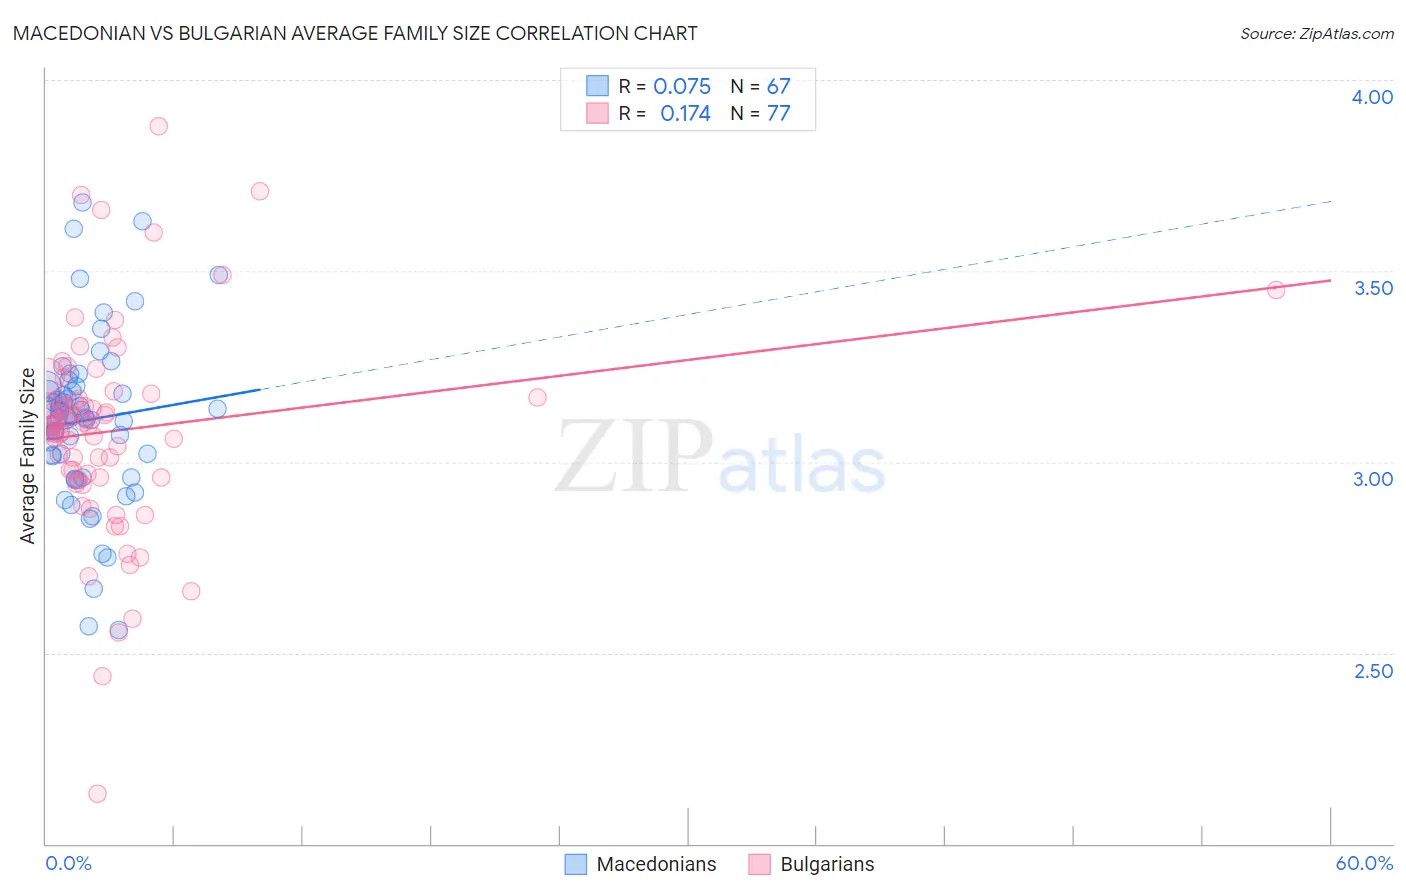
Macedonian vs Bulgarian Average Family Size Correlation Chart
The statistical analysis conducted on geographies consisting of 132,621,660 people shows a slight positive correlation between the proportion of Macedonians and average family size in the United States with a correlation coefficient (R) of 0.075 and weighted average of 3.13. Similarly, the statistical analysis conducted on geographies consisting of 205,566,985 people shows a poor positive correlation between the proportion of Bulgarians and average family size in the United States with a correlation coefficient (R) of 0.174 and weighted average of 3.13, a difference of 0.27%.
Average Family Size Correlation Summary
| Measurement | Macedonian | Bulgarian |
| Minimum | 2.56 | 2.13 |
| Maximum | 3.68 | 3.88 |
| Range | 1.12 | 1.75 |
| Mean | 3.11 | 3.08 |
| Median | 3.12 | 3.09 |
| Interquartile 25% (IQ1) | 3.02 | 2.96 |
| Interquartile 75% (IQ3) | 3.19 | 3.17 |
| Interquartile Range (IQR) | 0.17 | 0.21 |
| Standard Deviation (Sample) | 0.21 | 0.28 |
| Standard Deviation (Population) | 0.21 | 0.27 |
Demographics Similar to Macedonians and Bulgarians by Average Family Size
In terms of average family size, the demographic groups most similar to Macedonians are Immigrants from Latvia (3.13, a difference of 0.0%), British (3.13, a difference of 0.010%), Immigrants from Switzerland (3.13, a difference of 0.030%), Australian (3.13, a difference of 0.060%), and Immigrants from Sweden (3.14, a difference of 0.070%). Similarly, the demographic groups most similar to Bulgarians are Immigrants from Australia (3.13, a difference of 0.0%), Immigrants from Northern Europe (3.13, a difference of 0.030%), Russian (3.12, a difference of 0.040%), Immigrants from Scotland (3.12, a difference of 0.060%), and Czechoslovakian (3.13, a difference of 0.070%).
| Demographics | Rating | Rank | Average Family Size |
| Immigrants | Western Europe | 0.2 /100 | #297 | Tragic 3.14 |
| Colville | 0.2 /100 | #298 | Tragic 3.14 |
| Canadians | 0.2 /100 | #299 | Tragic 3.14 |
| Immigrants | Sweden | 0.2 /100 | #300 | Tragic 3.14 |
| Macedonians | 0.2 /100 | #301 | Tragic 3.13 |
| Immigrants | Latvia | 0.2 /100 | #302 | Tragic 3.13 |
| British | 0.2 /100 | #303 | Tragic 3.13 |
| Immigrants | Switzerland | 0.2 /100 | #304 | Tragic 3.13 |
| Australians | 0.1 /100 | #305 | Tragic 3.13 |
| Immigrants | Ireland | 0.1 /100 | #306 | Tragic 3.13 |
| Immigrants | Serbia | 0.1 /100 | #307 | Tragic 3.13 |
| Slavs | 0.1 /100 | #308 | Tragic 3.13 |
| Northern Europeans | 0.1 /100 | #309 | Tragic 3.13 |
| Czechoslovakians | 0.1 /100 | #310 | Tragic 3.13 |
| Immigrants | Northern Europe | 0.1 /100 | #311 | Tragic 3.13 |
| Immigrants | Australia | 0.1 /100 | #312 | Tragic 3.13 |
| Bulgarians | 0.1 /100 | #313 | Tragic 3.13 |
| Russians | 0.1 /100 | #314 | Tragic 3.12 |
| Immigrants | Scotland | 0.1 /100 | #315 | Tragic 3.12 |
| Serbians | 0.1 /100 | #316 | Tragic 3.12 |
| Italians | 0.1 /100 | #317 | Tragic 3.12 |