Lumbee vs Mexican American Indian Births to Unmarried Women
COMPARE
Lumbee
Mexican American Indian
Births to Unmarried Women
Births to Unmarried Women Comparison
Lumbee
Mexican American Indians
48.2%
BIRTHS TO UNMARRIED WOMEN
0.0/ 100
METRIC RATING
339th/ 347
METRIC RANK
35.7%
BIRTHS TO UNMARRIED WOMEN
0.4/ 100
METRIC RATING
250th/ 347
METRIC RANK
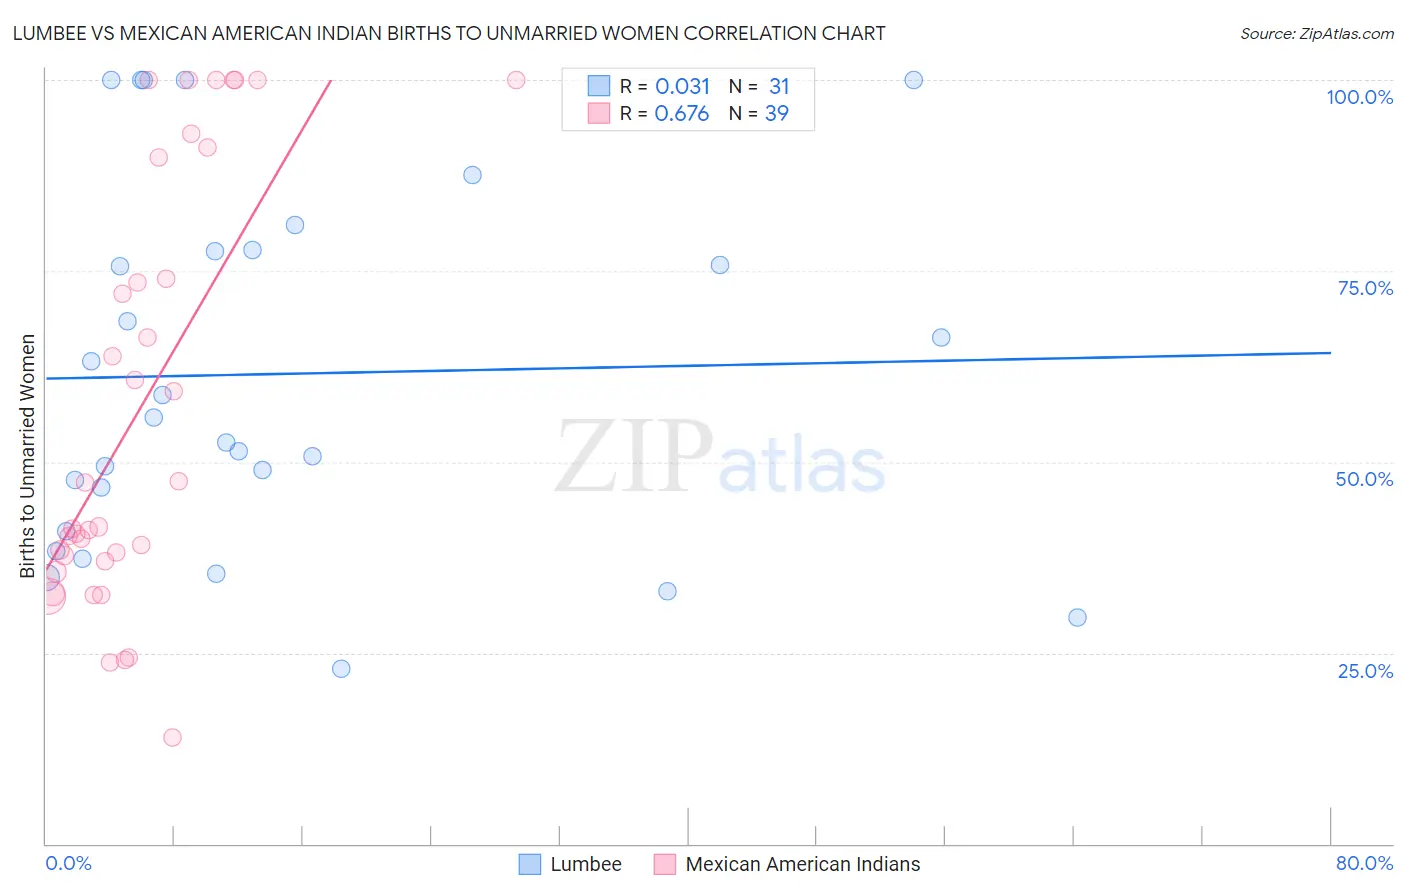
Lumbee vs Mexican American Indian Births to Unmarried Women Correlation Chart
The statistical analysis conducted on geographies consisting of 89,846,476 people shows no correlation between the proportion of Lumbee and percentage of births to unmarried women in the United States with a correlation coefficient (R) of 0.031 and weighted average of 48.2%. Similarly, the statistical analysis conducted on geographies consisting of 305,475,949 people shows a significant positive correlation between the proportion of Mexican American Indians and percentage of births to unmarried women in the United States with a correlation coefficient (R) of 0.676 and weighted average of 35.7%, a difference of 34.8%.
Births to Unmarried Women Correlation Summary
| Measurement | Lumbee | Mexican American Indian |
| Minimum | 22.9% | 13.9% |
| Maximum | 100.0% | 100.0% |
| Range | 77.1% | 86.1% |
| Mean | 61.5% | 57.1% |
| Median | 55.9% | 41.5% |
| Interquartile 25% (IQ1) | 40.9% | 36.9% |
| Interquartile 75% (IQ3) | 77.7% | 89.8% |
| Interquartile Range (IQR) | 36.8% | 52.9% |
| Standard Deviation (Sample) | 23.6% | 27.6% |
| Standard Deviation (Population) | 23.3% | 27.2% |
Similar Demographics by Births to Unmarried Women
Demographics Similar to Lumbee by Births to Unmarried Women
In terms of births to unmarried women, the demographic groups most similar to Lumbee are Arapaho (47.1%, a difference of 2.3%), Tohono O'odham (49.8%, a difference of 3.4%), Houma (46.6%, a difference of 3.5%), Hopi (50.8%, a difference of 5.4%), and Puerto Rican (45.7%, a difference of 5.5%).
| Demographics | Rating | Rank | Births to Unmarried Women |
| Kiowa | 0.0 /100 | #332 | Tragic 43.1% |
| Blacks/African Americans | 0.0 /100 | #333 | Tragic 44.3% |
| Yuman | 0.0 /100 | #334 | Tragic 44.4% |
| Colville | 0.0 /100 | #335 | Tragic 45.3% |
| Puerto Ricans | 0.0 /100 | #336 | Tragic 45.7% |
| Houma | 0.0 /100 | #337 | Tragic 46.6% |
| Arapaho | 0.0 /100 | #338 | Tragic 47.1% |
| Lumbee | 0.0 /100 | #339 | Tragic 48.2% |
| Tohono O'odham | 0.0 /100 | #340 | Tragic 49.8% |
| Hopi | 0.0 /100 | #341 | Tragic 50.8% |
| Menominee | 0.0 /100 | #342 | Tragic 51.1% |
| Pima | 0.0 /100 | #343 | Tragic 51.5% |
| Navajo | 0.0 /100 | #344 | Tragic 51.5% |
| Inupiat | 0.0 /100 | #345 | Tragic 52.1% |
| Pueblo | 0.0 /100 | #346 | Tragic 53.7% |
Demographics Similar to Mexican American Indians by Births to Unmarried Women
In terms of births to unmarried women, the demographic groups most similar to Mexican American Indians are Immigrants from Western Africa (36.0%, a difference of 0.57%), Bermudan (35.5%, a difference of 0.61%), Nonimmigrants (35.5%, a difference of 0.62%), Salvadoran (36.0%, a difference of 0.69%), and Immigrants from Nigeria (35.4%, a difference of 0.96%).
| Demographics | Rating | Rank | Births to Unmarried Women |
| Japanese | 0.9 /100 | #243 | Tragic 35.2% |
| Guyanese | 0.9 /100 | #244 | Tragic 35.2% |
| Shoshone | 0.8 /100 | #245 | Tragic 35.3% |
| Nigerians | 0.7 /100 | #246 | Tragic 35.3% |
| Immigrants | Nigeria | 0.7 /100 | #247 | Tragic 35.4% |
| Immigrants | Nonimmigrants | 0.6 /100 | #248 | Tragic 35.5% |
| Bermudans | 0.6 /100 | #249 | Tragic 35.5% |
| Mexican American Indians | 0.4 /100 | #250 | Tragic 35.7% |
| Immigrants | Western Africa | 0.3 /100 | #251 | Tragic 36.0% |
| Salvadorans | 0.3 /100 | #252 | Tragic 36.0% |
| Immigrants | Portugal | 0.2 /100 | #253 | Tragic 36.2% |
| Potawatomi | 0.2 /100 | #254 | Tragic 36.2% |
| Chickasaw | 0.2 /100 | #255 | Tragic 36.3% |
| Immigrants | Trinidad and Tobago | 0.2 /100 | #256 | Tragic 36.3% |
| Immigrants | Grenada | 0.2 /100 | #257 | Tragic 36.3% |