Lithuanian vs Immigrants from Nepal Single Mother Households
COMPARE
Lithuanian
Immigrants from Nepal
Single Mother Households
Single Mother Households Comparison
Lithuanians
Immigrants from Nepal
5.4%
SINGLE MOTHER HOUSEHOLDS
99.4/ 100
METRIC RATING
44th/ 347
METRIC RANK
6.4%
SINGLE MOTHER HOUSEHOLDS
36.1/ 100
METRIC RATING
180th/ 347
METRIC RANK
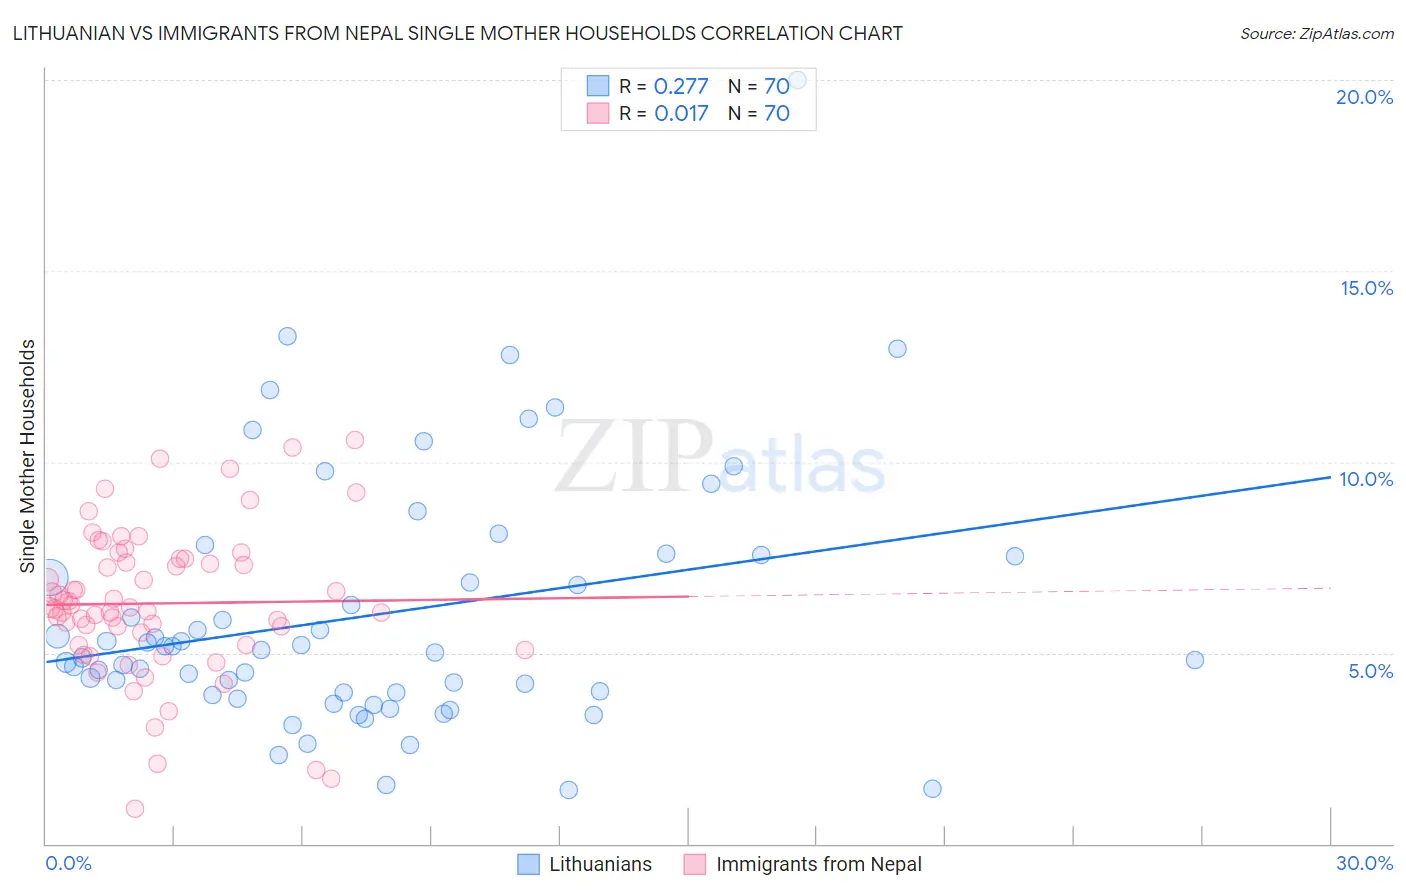
Lithuanian vs Immigrants from Nepal Single Mother Households Correlation Chart
The statistical analysis conducted on geographies consisting of 420,116,191 people shows a weak positive correlation between the proportion of Lithuanians and percentage of single mother households in the United States with a correlation coefficient (R) of 0.277 and weighted average of 5.4%. Similarly, the statistical analysis conducted on geographies consisting of 186,604,870 people shows no correlation between the proportion of Immigrants from Nepal and percentage of single mother households in the United States with a correlation coefficient (R) of 0.017 and weighted average of 6.4%, a difference of 17.9%.
Single Mother Households Correlation Summary
| Measurement | Lithuanian | Immigrants from Nepal |
| Minimum | 1.4% | 0.90% |
| Maximum | 20.0% | 10.6% |
| Range | 18.6% | 9.7% |
| Mean | 6.0% | 6.3% |
| Median | 5.0% | 6.2% |
| Interquartile 25% (IQ1) | 4.0% | 5.2% |
| Interquartile 75% (IQ3) | 7.5% | 7.5% |
| Interquartile Range (IQR) | 3.6% | 2.2% |
| Standard Deviation (Sample) | 3.3% | 1.9% |
| Standard Deviation (Population) | 3.3% | 1.9% |
Similar Demographics by Single Mother Households
Demographics Similar to Lithuanians by Single Mother Households
In terms of single mother households, the demographic groups most similar to Lithuanians are Immigrants from Croatia (5.4%, a difference of 0.12%), Croatian (5.5%, a difference of 0.38%), Norwegian (5.5%, a difference of 0.56%), Immigrants from South Central Asia (5.4%, a difference of 0.70%), and Macedonian (5.4%, a difference of 0.76%).
| Demographics | Rating | Rank | Single Mother Households |
| Immigrants | Belgium | 99.7 /100 | #37 | Exceptional 5.3% |
| Immigrants | Serbia | 99.6 /100 | #38 | Exceptional 5.4% |
| Immigrants | Sweden | 99.6 /100 | #39 | Exceptional 5.4% |
| Estonians | 99.6 /100 | #40 | Exceptional 5.4% |
| Immigrants | Greece | 99.5 /100 | #41 | Exceptional 5.4% |
| Macedonians | 99.5 /100 | #42 | Exceptional 5.4% |
| Immigrants | South Central Asia | 99.5 /100 | #43 | Exceptional 5.4% |
| Lithuanians | 99.4 /100 | #44 | Exceptional 5.4% |
| Immigrants | Croatia | 99.4 /100 | #45 | Exceptional 5.4% |
| Croatians | 99.3 /100 | #46 | Exceptional 5.5% |
| Norwegians | 99.3 /100 | #47 | Exceptional 5.5% |
| Turks | 99.2 /100 | #48 | Exceptional 5.5% |
| Immigrants | Latvia | 99.2 /100 | #49 | Exceptional 5.5% |
| Immigrants | Scotland | 99.2 /100 | #50 | Exceptional 5.5% |
| Immigrants | Belarus | 99.2 /100 | #51 | Exceptional 5.5% |
Demographics Similar to Immigrants from Nepal by Single Mother Households
In terms of single mother households, the demographic groups most similar to Immigrants from Nepal are Spanish (6.4%, a difference of 0.32%), South American Indian (6.4%, a difference of 0.32%), Hmong (6.4%, a difference of 0.43%), Portuguese (6.4%, a difference of 0.45%), and Osage (6.4%, a difference of 0.79%).
| Demographics | Rating | Rank | Single Mother Households |
| Immigrants | Vietnam | 51.5 /100 | #173 | Average 6.3% |
| Immigrants | Morocco | 50.0 /100 | #174 | Average 6.3% |
| Marshallese | 45.8 /100 | #175 | Average 6.3% |
| Immigrants | Bosnia and Herzegovina | 44.3 /100 | #176 | Average 6.3% |
| Osage | 43.0 /100 | #177 | Average 6.4% |
| Portuguese | 40.0 /100 | #178 | Fair 6.4% |
| Hmong | 39.8 /100 | #179 | Fair 6.4% |
| Immigrants | Nepal | 36.1 /100 | #180 | Fair 6.4% |
| Spanish | 33.4 /100 | #181 | Fair 6.4% |
| South American Indians | 33.4 /100 | #182 | Fair 6.4% |
| Spaniards | 27.8 /100 | #183 | Fair 6.5% |
| Ethiopians | 26.0 /100 | #184 | Fair 6.5% |
| Ugandans | 25.6 /100 | #185 | Fair 6.5% |
| Costa Ricans | 24.8 /100 | #186 | Fair 6.5% |
| Immigrants | Afghanistan | 24.7 /100 | #187 | Fair 6.5% |