Lithuanian vs Immigrants from Cameroon Average Family Size
COMPARE
Lithuanian
Immigrants from Cameroon
Average Family Size
Average Family Size Comparison
Lithuanians
Immigrants from Cameroon
3.10
AVERAGE FAMILY SIZE
0.0/ 100
METRIC RATING
334th/ 347
METRIC RANK
3.30
AVERAGE FAMILY SIZE
99.2/ 100
METRIC RATING
92nd/ 347
METRIC RANK
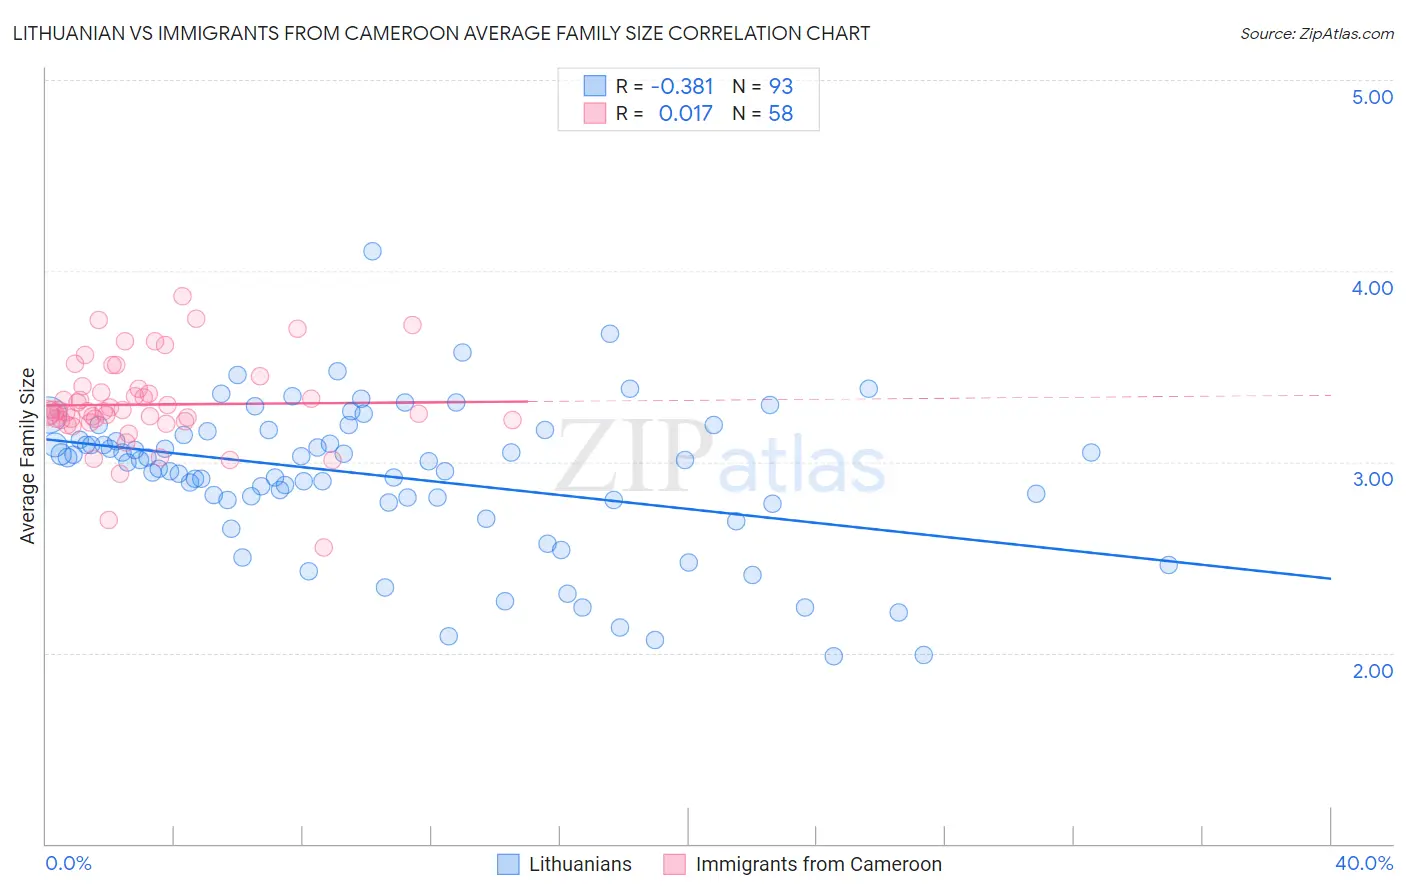
Lithuanian vs Immigrants from Cameroon Average Family Size Correlation Chart
The statistical analysis conducted on geographies consisting of 421,743,264 people shows a mild negative correlation between the proportion of Lithuanians and average family size in the United States with a correlation coefficient (R) of -0.381 and weighted average of 3.10. Similarly, the statistical analysis conducted on geographies consisting of 130,723,940 people shows no correlation between the proportion of Immigrants from Cameroon and average family size in the United States with a correlation coefficient (R) of 0.017 and weighted average of 3.30, a difference of 6.3%.
Average Family Size Correlation Summary
| Measurement | Lithuanian | Immigrants from Cameroon |
| Minimum | 1.98 | 2.55 |
| Maximum | 4.10 | 3.87 |
| Range | 2.12 | 1.32 |
| Mean | 2.92 | 3.30 |
| Median | 3.00 | 3.26 |
| Interquartile 25% (IQ1) | 2.79 | 3.22 |
| Interquartile 75% (IQ3) | 3.15 | 3.38 |
| Interquartile Range (IQR) | 0.36 | 0.17 |
| Standard Deviation (Sample) | 0.39 | 0.24 |
| Standard Deviation (Population) | 0.38 | 0.23 |
Similar Demographics by Average Family Size
Demographics Similar to Lithuanians by Average Family Size
In terms of average family size, the demographic groups most similar to Lithuanians are Estonian (3.10, a difference of 0.0%), Luxembourger (3.10, a difference of 0.030%), Scotch-Irish (3.11, a difference of 0.050%), Scottish (3.11, a difference of 0.050%), and Latvian (3.11, a difference of 0.060%).
| Demographics | Rating | Rank | Average Family Size |
| Dutch | 0.0 /100 | #327 | Tragic 3.11 |
| Czechs | 0.0 /100 | #328 | Tragic 3.11 |
| Belgians | 0.0 /100 | #329 | Tragic 3.11 |
| Latvians | 0.0 /100 | #330 | Tragic 3.11 |
| Scotch-Irish | 0.0 /100 | #331 | Tragic 3.11 |
| Scottish | 0.0 /100 | #332 | Tragic 3.11 |
| Estonians | 0.0 /100 | #333 | Tragic 3.10 |
| Lithuanians | 0.0 /100 | #334 | Tragic 3.10 |
| Luxembourgers | 0.0 /100 | #335 | Tragic 3.10 |
| Irish | 0.0 /100 | #336 | Tragic 3.10 |
| Swedes | 0.0 /100 | #337 | Tragic 3.10 |
| French | 0.0 /100 | #338 | Tragic 3.10 |
| Croatians | 0.0 /100 | #339 | Tragic 3.10 |
| Finns | 0.0 /100 | #340 | Tragic 3.09 |
| Poles | 0.0 /100 | #341 | Tragic 3.09 |
Demographics Similar to Immigrants from Cameroon by Average Family Size
In terms of average family size, the demographic groups most similar to Immigrants from Cameroon are Immigrants from Pakistan (3.30, a difference of 0.010%), Peruvian (3.30, a difference of 0.010%), Sierra Leonean (3.30, a difference of 0.11%), Immigrants from Lebanon (3.30, a difference of 0.12%), and Menominee (3.30, a difference of 0.16%).
| Demographics | Rating | Rank | Average Family Size |
| Afghans | 99.7 /100 | #85 | Exceptional 3.31 |
| Jamaicans | 99.7 /100 | #86 | Exceptional 3.31 |
| Immigrants | Peru | 99.7 /100 | #87 | Exceptional 3.31 |
| Immigrants | Bolivia | 99.6 /100 | #88 | Exceptional 3.31 |
| Malaysians | 99.6 /100 | #89 | Exceptional 3.31 |
| Menominee | 99.4 /100 | #90 | Exceptional 3.30 |
| Immigrants | Pakistan | 99.2 /100 | #91 | Exceptional 3.30 |
| Immigrants | Cameroon | 99.2 /100 | #92 | Exceptional 3.30 |
| Peruvians | 99.2 /100 | #93 | Exceptional 3.30 |
| Sierra Leoneans | 99.0 /100 | #94 | Exceptional 3.30 |
| Immigrants | Lebanon | 99.0 /100 | #95 | Exceptional 3.30 |
| U.S. Virgin Islanders | 98.8 /100 | #96 | Exceptional 3.29 |
| Immigrants | Oceania | 98.7 /100 | #97 | Exceptional 3.29 |
| Barbadians | 98.6 /100 | #98 | Exceptional 3.29 |
| Nigerians | 98.6 /100 | #99 | Exceptional 3.29 |