Liberian vs Turkish Divorced or Separated
COMPARE
Liberian
Turkish
Divorced or Separated
Divorced or Separated Comparison
Liberians
Turks
12.6%
DIVORCED OR SEPARATED
0.9/ 100
METRIC RATING
252nd/ 347
METRIC RANK
11.2%
DIVORCED OR SEPARATED
100.0/ 100
METRIC RATING
45th/ 347
METRIC RANK
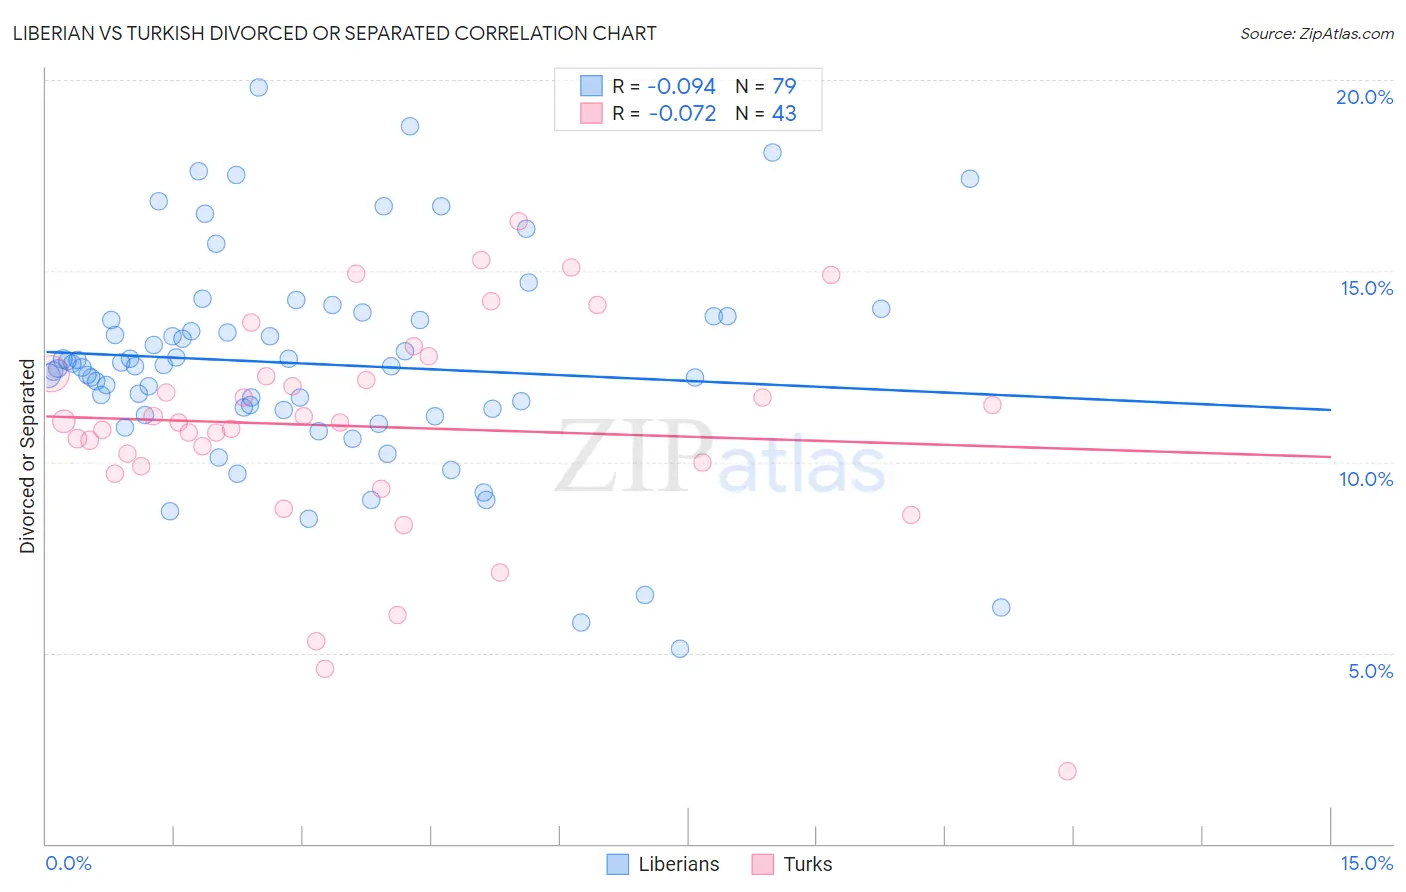
Liberian vs Turkish Divorced or Separated Correlation Chart
The statistical analysis conducted on geographies consisting of 118,063,038 people shows a slight negative correlation between the proportion of Liberians and percentage of population currently divorced or separated in the United States with a correlation coefficient (R) of -0.094 and weighted average of 12.6%. Similarly, the statistical analysis conducted on geographies consisting of 271,738,406 people shows a slight negative correlation between the proportion of Turks and percentage of population currently divorced or separated in the United States with a correlation coefficient (R) of -0.072 and weighted average of 11.2%, a difference of 12.1%.
Divorced or Separated Correlation Summary
| Measurement | Liberian | Turkish |
| Minimum | 5.1% | 1.9% |
| Maximum | 19.8% | 16.3% |
| Range | 14.7% | 14.4% |
| Mean | 12.6% | 10.9% |
| Median | 12.5% | 11.0% |
| Interquartile 25% (IQ1) | 11.3% | 9.9% |
| Interquartile 75% (IQ3) | 13.8% | 12.3% |
| Interquartile Range (IQR) | 2.5% | 2.4% |
| Standard Deviation (Sample) | 2.8% | 2.9% |
| Standard Deviation (Population) | 2.8% | 2.9% |
Similar Demographics by Divorced or Separated
Demographics Similar to Liberians by Divorced or Separated
In terms of divorced or separated, the demographic groups most similar to Liberians are Somali (12.6%, a difference of 0.0%), Senegalese (12.6%, a difference of 0.060%), Welsh (12.6%, a difference of 0.16%), Immigrants from Colombia (12.6%, a difference of 0.32%), and Irish (12.5%, a difference of 0.33%).
| Demographics | Rating | Rank | Divorced or Separated |
| Hispanics or Latinos | 2.0 /100 | #245 | Tragic 12.5% |
| Immigrants | West Indies | 1.9 /100 | #246 | Tragic 12.5% |
| Germans | 1.8 /100 | #247 | Tragic 12.5% |
| Nepalese | 1.8 /100 | #248 | Tragic 12.5% |
| Finns | 1.8 /100 | #249 | Tragic 12.5% |
| Irish | 1.3 /100 | #250 | Tragic 12.5% |
| Aleuts | 1.3 /100 | #251 | Tragic 12.5% |
| Liberians | 0.9 /100 | #252 | Tragic 12.6% |
| Somalis | 0.9 /100 | #253 | Tragic 12.6% |
| Senegalese | 0.8 /100 | #254 | Tragic 12.6% |
| Welsh | 0.7 /100 | #255 | Tragic 12.6% |
| Immigrants | Colombia | 0.6 /100 | #256 | Tragic 12.6% |
| Immigrants | Somalia | 0.6 /100 | #257 | Tragic 12.6% |
| Indonesians | 0.6 /100 | #258 | Tragic 12.6% |
| Yuman | 0.6 /100 | #259 | Tragic 12.6% |
Demographics Similar to Turks by Divorced or Separated
In terms of divorced or separated, the demographic groups most similar to Turks are Immigrants from Western Asia (11.2%, a difference of 0.050%), Immigrants from Belarus (11.2%, a difference of 0.060%), Chinese (11.2%, a difference of 0.070%), Laotian (11.2%, a difference of 0.11%), and Immigrants from Poland (11.2%, a difference of 0.12%).
| Demographics | Rating | Rank | Divorced or Separated |
| Immigrants | Greece | 100.0 /100 | #38 | Exceptional 11.1% |
| Immigrants | Egypt | 100.0 /100 | #39 | Exceptional 11.1% |
| Soviet Union | 100.0 /100 | #40 | Exceptional 11.1% |
| Bhutanese | 100.0 /100 | #41 | Exceptional 11.2% |
| Chinese | 100.0 /100 | #42 | Exceptional 11.2% |
| Immigrants | Belarus | 100.0 /100 | #43 | Exceptional 11.2% |
| Immigrants | Western Asia | 100.0 /100 | #44 | Exceptional 11.2% |
| Turks | 100.0 /100 | #45 | Exceptional 11.2% |
| Laotians | 100.0 /100 | #46 | Exceptional 11.2% |
| Immigrants | Poland | 100.0 /100 | #47 | Exceptional 11.2% |
| Immigrants | Turkey | 100.0 /100 | #48 | Exceptional 11.2% |
| Immigrants | Saudi Arabia | 100.0 /100 | #49 | Exceptional 11.2% |
| Bolivians | 100.0 /100 | #50 | Exceptional 11.2% |
| Immigrants | Bolivia | 100.0 /100 | #51 | Exceptional 11.3% |
| Immigrants | Australia | 99.9 /100 | #52 | Exceptional 11.3% |