Liberian vs Immigrants from Iraq Single Father Households
COMPARE
Liberian
Immigrants from Iraq
Single Father Households
Single Father Households Comparison
Liberians
Immigrants from Iraq
2.5%
SINGLE FATHER HOUSEHOLDS
2.0/ 100
METRIC RATING
251st/ 347
METRIC RANK
2.2%
SINGLE FATHER HOUSEHOLDS
97.6/ 100
METRIC RATING
122nd/ 347
METRIC RANK
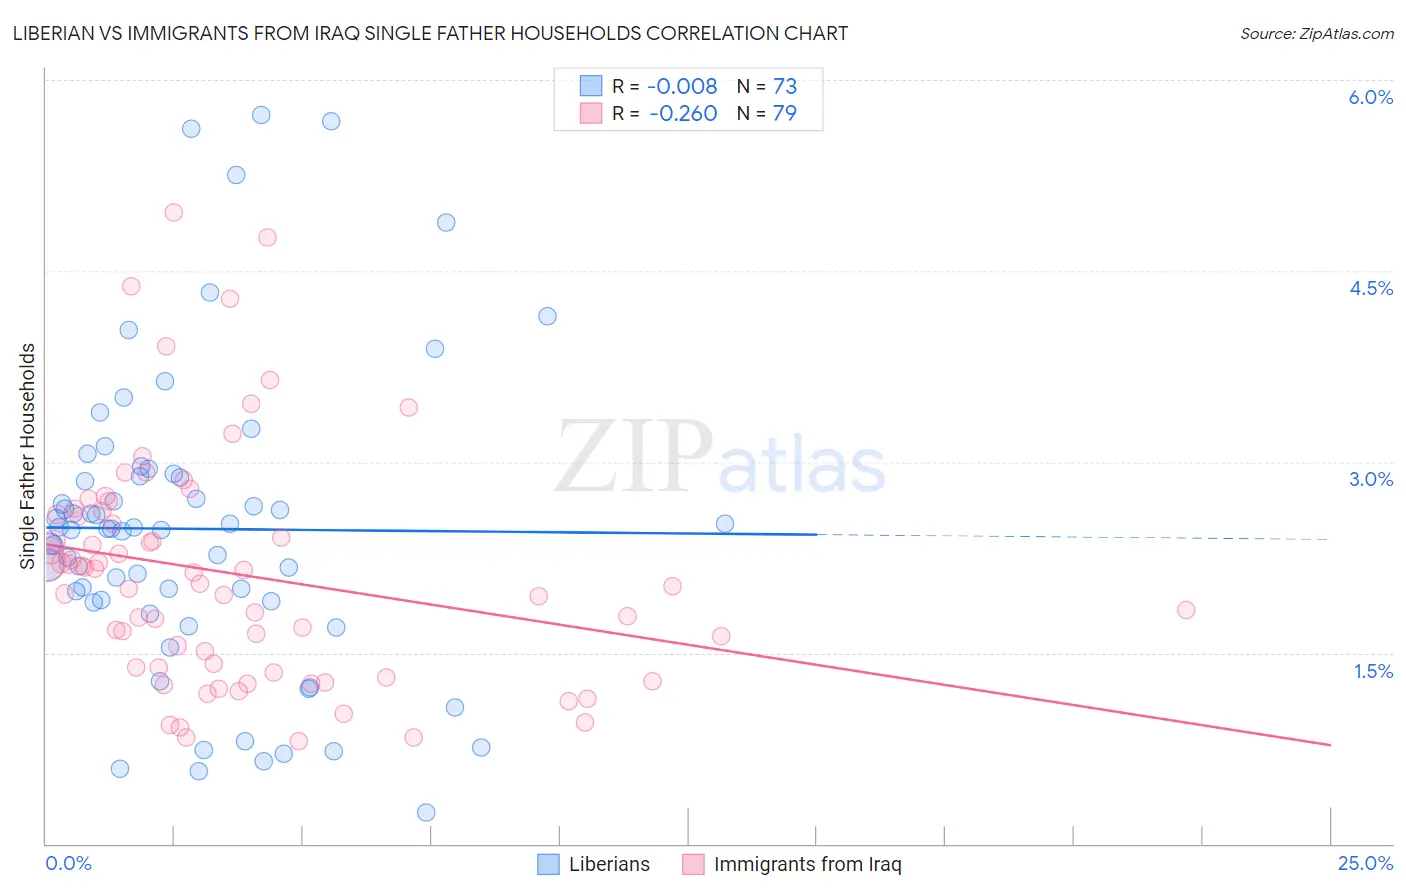
Liberian vs Immigrants from Iraq Single Father Households Correlation Chart
The statistical analysis conducted on geographies consisting of 117,831,420 people shows no correlation between the proportion of Liberians and percentage of single father households in the United States with a correlation coefficient (R) of -0.008 and weighted average of 2.5%. Similarly, the statistical analysis conducted on geographies consisting of 194,132,696 people shows a weak negative correlation between the proportion of Immigrants from Iraq and percentage of single father households in the United States with a correlation coefficient (R) of -0.260 and weighted average of 2.2%, a difference of 15.0%.
Single Father Households Correlation Summary
| Measurement | Liberian | Immigrants from Iraq |
| Minimum | 0.24% | 0.80% |
| Maximum | 5.7% | 5.0% |
| Range | 5.5% | 4.2% |
| Mean | 2.5% | 2.1% |
| Median | 2.5% | 2.0% |
| Interquartile 25% (IQ1) | 1.9% | 1.4% |
| Interquartile 75% (IQ3) | 2.9% | 2.6% |
| Interquartile Range (IQR) | 0.99% | 1.2% |
| Standard Deviation (Sample) | 1.2% | 0.91% |
| Standard Deviation (Population) | 1.2% | 0.90% |
Similar Demographics by Single Father Households
Demographics Similar to Liberians by Single Father Households
In terms of single father households, the demographic groups most similar to Liberians are Immigrants from Eritrea (2.5%, a difference of 0.020%), Somali (2.5%, a difference of 0.090%), Immigrants from Somalia (2.5%, a difference of 0.090%), Immigrants from Thailand (2.5%, a difference of 0.13%), and Immigrants from Cameroon (2.5%, a difference of 0.26%).
| Demographics | Rating | Rank | Single Father Households |
| Immigrants | Middle Africa | 2.8 /100 | #244 | Tragic 2.5% |
| Basques | 2.5 /100 | #245 | Tragic 2.5% |
| Native Hawaiians | 2.5 /100 | #246 | Tragic 2.5% |
| Delaware | 2.5 /100 | #247 | Tragic 2.5% |
| Bahamians | 2.4 /100 | #248 | Tragic 2.5% |
| Immigrants | Cameroon | 2.3 /100 | #249 | Tragic 2.5% |
| Somalis | 2.1 /100 | #250 | Tragic 2.5% |
| Liberians | 2.0 /100 | #251 | Tragic 2.5% |
| Immigrants | Eritrea | 2.0 /100 | #252 | Tragic 2.5% |
| Immigrants | Somalia | 1.9 /100 | #253 | Tragic 2.5% |
| Immigrants | Thailand | 1.8 /100 | #254 | Tragic 2.5% |
| Tongans | 1.5 /100 | #255 | Tragic 2.5% |
| Potawatomi | 1.4 /100 | #256 | Tragic 2.5% |
| Immigrants | Congo | 1.2 /100 | #257 | Tragic 2.5% |
| Spanish | 1.1 /100 | #258 | Tragic 2.5% |
Demographics Similar to Immigrants from Iraq by Single Father Households
In terms of single father households, the demographic groups most similar to Immigrants from Iraq are Australian (2.2%, a difference of 0.10%), Immigrants from Brazil (2.2%, a difference of 0.10%), Trinidadian and Tobagonian (2.2%, a difference of 0.13%), Immigrants from Yemen (2.2%, a difference of 0.15%), and British West Indian (2.2%, a difference of 0.17%).
| Demographics | Rating | Rank | Single Father Households |
| Immigrants | Barbados | 98.2 /100 | #115 | Exceptional 2.2% |
| Immigrants | Argentina | 98.1 /100 | #116 | Exceptional 2.2% |
| Hungarians | 97.9 /100 | #117 | Exceptional 2.2% |
| Immigrants | Morocco | 97.8 /100 | #118 | Exceptional 2.2% |
| Trinidadians and Tobagonians | 97.8 /100 | #119 | Exceptional 2.2% |
| Australians | 97.7 /100 | #120 | Exceptional 2.2% |
| Immigrants | Brazil | 97.7 /100 | #121 | Exceptional 2.2% |
| Immigrants | Iraq | 97.6 /100 | #122 | Exceptional 2.2% |
| Immigrants | Yemen | 97.5 /100 | #123 | Exceptional 2.2% |
| British West Indians | 97.4 /100 | #124 | Exceptional 2.2% |
| Immigrants | Indonesia | 97.4 /100 | #125 | Exceptional 2.2% |
| Moroccans | 96.9 /100 | #126 | Exceptional 2.2% |
| Jordanians | 96.9 /100 | #127 | Exceptional 2.2% |
| Immigrants | England | 96.8 /100 | #128 | Exceptional 2.2% |
| Serbians | 96.8 /100 | #129 | Exceptional 2.2% |