Lebanese vs Bangladeshi Divorced or Separated
COMPARE
Lebanese
Bangladeshi
Divorced or Separated
Divorced or Separated Comparison
Lebanese
Bangladeshis
11.9%
DIVORCED OR SEPARATED
83.4/ 100
METRIC RATING
140th/ 347
METRIC RANK
12.3%
DIVORCED OR SEPARATED
10.5/ 100
METRIC RATING
222nd/ 347
METRIC RANK
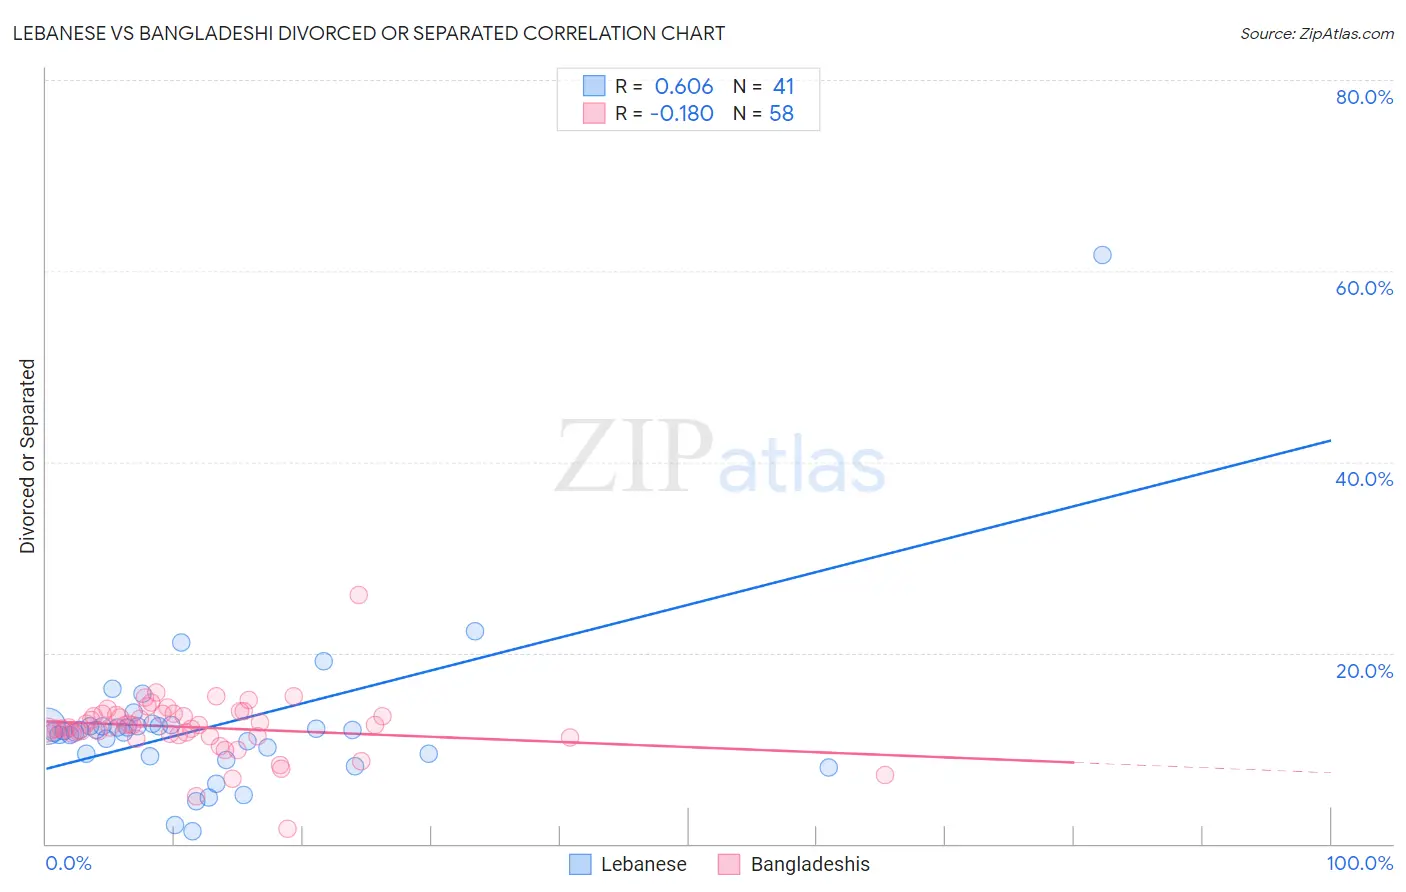
Lebanese vs Bangladeshi Divorced or Separated Correlation Chart
The statistical analysis conducted on geographies consisting of 401,417,076 people shows a significant positive correlation between the proportion of Lebanese and percentage of population currently divorced or separated in the United States with a correlation coefficient (R) of 0.606 and weighted average of 11.9%. Similarly, the statistical analysis conducted on geographies consisting of 141,409,827 people shows a poor negative correlation between the proportion of Bangladeshis and percentage of population currently divorced or separated in the United States with a correlation coefficient (R) of -0.180 and weighted average of 12.3%, a difference of 3.3%.
Divorced or Separated Correlation Summary
| Measurement | Lebanese | Bangladeshi |
| Minimum | 1.3% | 1.6% |
| Maximum | 61.7% | 26.0% |
| Range | 60.4% | 24.4% |
| Mean | 12.4% | 12.2% |
| Median | 11.8% | 12.3% |
| Interquartile 25% (IQ1) | 9.2% | 11.4% |
| Interquartile 75% (IQ3) | 12.3% | 13.6% |
| Interquartile Range (IQR) | 3.1% | 2.2% |
| Standard Deviation (Sample) | 9.0% | 3.2% |
| Standard Deviation (Population) | 8.9% | 3.1% |
Similar Demographics by Divorced or Separated
Demographics Similar to Lebanese by Divorced or Separated
In terms of divorced or separated, the demographic groups most similar to Lebanese are Australian (11.9%, a difference of 0.020%), Immigrants from Netherlands (11.9%, a difference of 0.030%), Immigrants from Morocco (11.9%, a difference of 0.030%), Alsatian (11.9%, a difference of 0.040%), and Carpatho Rusyn (11.9%, a difference of 0.090%).
| Demographics | Rating | Rank | Divorced or Separated |
| New Zealanders | 87.5 /100 | #133 | Excellent 11.9% |
| Argentineans | 85.1 /100 | #134 | Excellent 11.9% |
| Danes | 84.8 /100 | #135 | Excellent 11.9% |
| Carpatho Rusyns | 84.8 /100 | #136 | Excellent 11.9% |
| Alsatians | 84.0 /100 | #137 | Excellent 11.9% |
| Immigrants | Netherlands | 83.9 /100 | #138 | Excellent 11.9% |
| Australians | 83.6 /100 | #139 | Excellent 11.9% |
| Lebanese | 83.4 /100 | #140 | Excellent 11.9% |
| Immigrants | Morocco | 82.9 /100 | #141 | Excellent 11.9% |
| Immigrants | Zimbabwe | 81.5 /100 | #142 | Excellent 11.9% |
| Pakistanis | 81.3 /100 | #143 | Excellent 11.9% |
| Peruvians | 80.9 /100 | #144 | Excellent 11.9% |
| Croatians | 80.6 /100 | #145 | Excellent 11.9% |
| Immigrants | Grenada | 79.1 /100 | #146 | Good 11.9% |
| Poles | 78.6 /100 | #147 | Good 11.9% |
Demographics Similar to Bangladeshis by Divorced or Separated
In terms of divorced or separated, the demographic groups most similar to Bangladeshis are Scandinavian (12.3%, a difference of 0.010%), Guamanian/Chamorro (12.3%, a difference of 0.070%), Immigrants from the Azores (12.3%, a difference of 0.070%), Belgian (12.3%, a difference of 0.080%), and British (12.3%, a difference of 0.10%).
| Demographics | Rating | Rank | Divorced or Separated |
| Europeans | 15.4 /100 | #215 | Poor 12.2% |
| Immigrants | South America | 15.4 /100 | #216 | Poor 12.2% |
| Northern Europeans | 14.7 /100 | #217 | Poor 12.2% |
| Slovenes | 13.2 /100 | #218 | Poor 12.3% |
| Czechoslovakians | 11.7 /100 | #219 | Poor 12.3% |
| British | 11.6 /100 | #220 | Poor 12.3% |
| Guamanians/Chamorros | 11.3 /100 | #221 | Poor 12.3% |
| Bangladeshis | 10.5 /100 | #222 | Poor 12.3% |
| Scandinavians | 10.4 /100 | #223 | Poor 12.3% |
| Immigrants | Azores | 9.7 /100 | #224 | Tragic 12.3% |
| Belgians | 9.7 /100 | #225 | Tragic 12.3% |
| Immigrants | Western Africa | 9.3 /100 | #226 | Tragic 12.3% |
| Hmong | 8.8 /100 | #227 | Tragic 12.3% |
| Immigrants | Cameroon | 8.3 /100 | #228 | Tragic 12.3% |
| Immigrants | Sudan | 8.2 /100 | #229 | Tragic 12.3% |