Latvian vs French American Indian Family Households with Children
COMPARE
Latvian
French American Indian
Family Households with Children
Family Households with Children Comparison
Latvians
French American Indians
26.4%
FAMILY HOUSEHOLDS WITH CHILDREN
0.1/ 100
METRIC RATING
294th/ 347
METRIC RANK
26.6%
FAMILY HOUSEHOLDS WITH CHILDREN
0.3/ 100
METRIC RATING
282nd/ 347
METRIC RANK
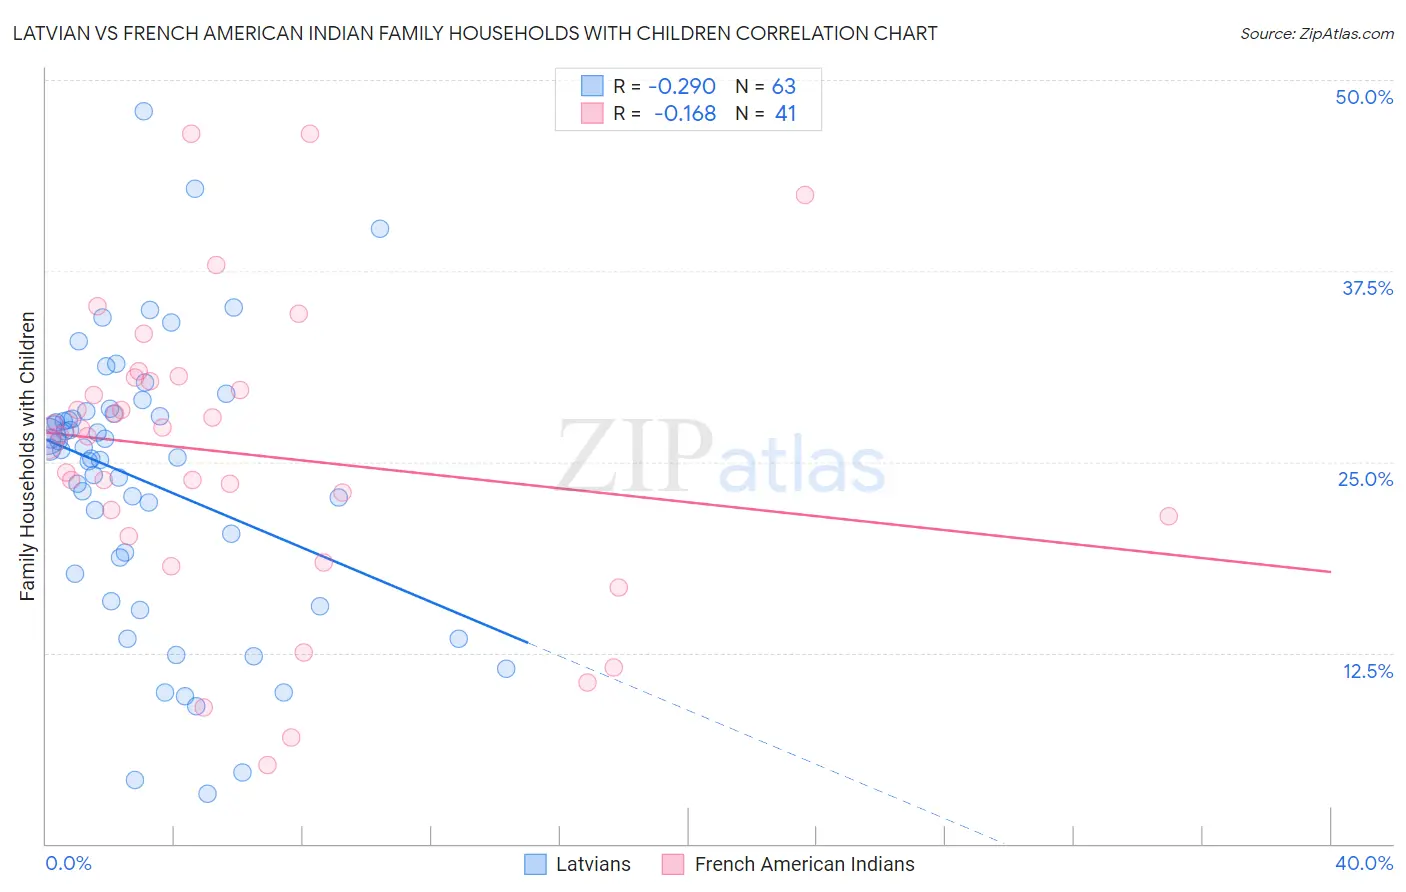
Latvian vs French American Indian Family Households with Children Correlation Chart
The statistical analysis conducted on geographies consisting of 220,571,323 people shows a weak negative correlation between the proportion of Latvians and percentage of family households with children in the United States with a correlation coefficient (R) of -0.290 and weighted average of 26.4%. Similarly, the statistical analysis conducted on geographies consisting of 131,954,701 people shows a poor negative correlation between the proportion of French American Indians and percentage of family households with children in the United States with a correlation coefficient (R) of -0.168 and weighted average of 26.6%, a difference of 0.47%.
Family Households with Children Correlation Summary
| Measurement | Latvian | French American Indian |
| Minimum | 3.3% | 5.1% |
| Maximum | 48.0% | 46.5% |
| Range | 44.7% | 41.4% |
| Mean | 23.7% | 25.5% |
| Median | 25.8% | 26.7% |
| Interquartile 25% (IQ1) | 17.7% | 20.8% |
| Interquartile 75% (IQ3) | 28.1% | 30.4% |
| Interquartile Range (IQR) | 10.4% | 9.6% |
| Standard Deviation (Sample) | 9.1% | 9.5% |
| Standard Deviation (Population) | 9.0% | 9.4% |
Demographics Similar to Latvians and French American Indians by Family Households with Children
In terms of family households with children, the demographic groups most similar to Latvians are Black/African American (26.5%, a difference of 0.060%), Macedonian (26.4%, a difference of 0.080%), Croatian (26.4%, a difference of 0.10%), Polish (26.5%, a difference of 0.11%), and Armenian (26.4%, a difference of 0.11%). Similarly, the demographic groups most similar to French American Indians are Lithuanian (26.6%, a difference of 0.010%), Immigrants from North America (26.6%, a difference of 0.070%), Immigrants from Canada (26.5%, a difference of 0.090%), Senegalese (26.6%, a difference of 0.11%), and Cambodian (26.5%, a difference of 0.12%).
| Demographics | Rating | Rank | Family Households with Children |
| Immigrants | Europe | 0.4 /100 | #278 | Tragic 26.6% |
| Finns | 0.4 /100 | #279 | Tragic 26.6% |
| Senegalese | 0.4 /100 | #280 | Tragic 26.6% |
| Lithuanians | 0.3 /100 | #281 | Tragic 26.6% |
| French American Indians | 0.3 /100 | #282 | Tragic 26.6% |
| Immigrants | North America | 0.3 /100 | #283 | Tragic 26.6% |
| Immigrants | Canada | 0.3 /100 | #284 | Tragic 26.5% |
| Cambodians | 0.2 /100 | #285 | Tragic 26.5% |
| Immigrants | Senegal | 0.2 /100 | #286 | Tragic 26.5% |
| Shoshone | 0.2 /100 | #287 | Tragic 26.5% |
| Russians | 0.2 /100 | #288 | Tragic 26.5% |
| Immigrants | Sweden | 0.2 /100 | #289 | Tragic 26.5% |
| Albanians | 0.2 /100 | #290 | Tragic 26.5% |
| Bahamians | 0.2 /100 | #291 | Tragic 26.5% |
| Poles | 0.2 /100 | #292 | Tragic 26.5% |
| Blacks/African Americans | 0.1 /100 | #293 | Tragic 26.5% |
| Latvians | 0.1 /100 | #294 | Tragic 26.4% |
| Macedonians | 0.1 /100 | #295 | Tragic 26.4% |
| Croatians | 0.1 /100 | #296 | Tragic 26.4% |
| Armenians | 0.1 /100 | #297 | Tragic 26.4% |
| Immigrants | Western Europe | 0.1 /100 | #298 | Tragic 26.4% |